一、Matplotlib简介
Matplotlib is a comprehensive library for creating static, animated, and interactive visualizations in Python. Matplotlib makes easy things easy and hard things possible.
二、使用Matplotlib生成图像
1、线形图
# 折线图
import numpy as np
import matplotlib.pyplot as plt

x = np.random.random(10)
plt.plot(x)
plt.show()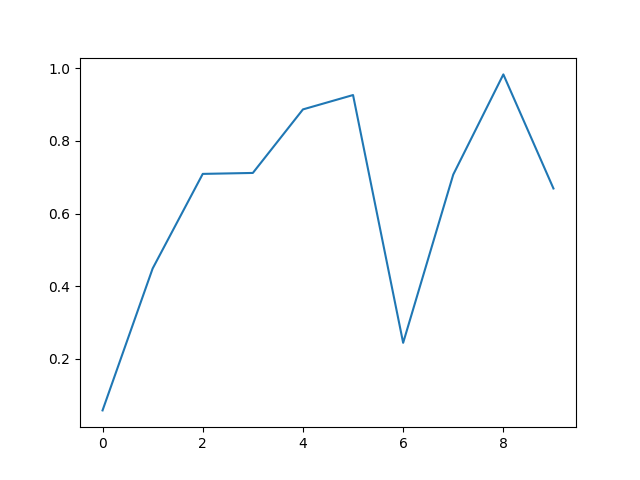
# 直线图
import numpy as np
import matplotlib.pyplot as plt

x = np.linspace(1, 10, 10)
plt.plot(x)
plt.show()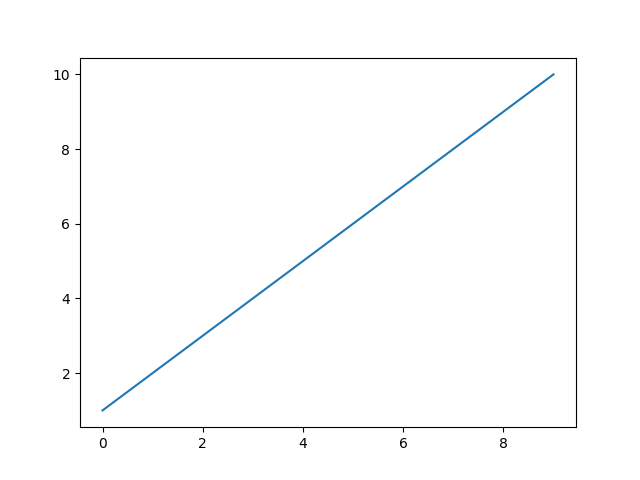
# 曲线图
import numpy as np
import matplotlib.pyplot as plt

x = np.linspace(1, 10, 10)
plt.plot(x, x ** 2)
plt.show()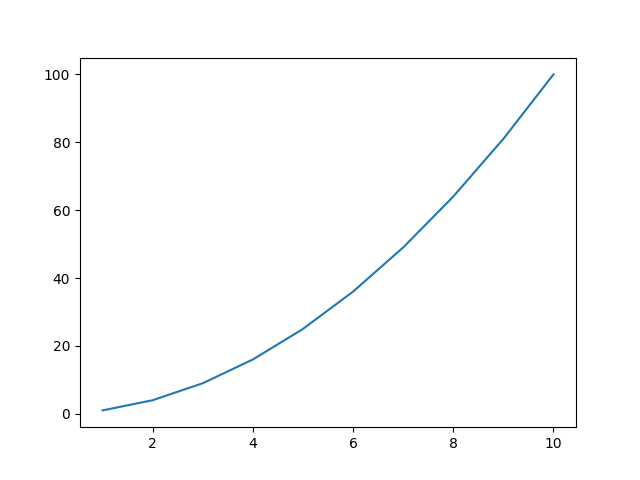
# 点状图
import numpy as np
import matplotlib.pyplot as plt

x = np.linspace(1, 10, 10)
plt.plot(x, x ** 2, 'bo')
plt.show()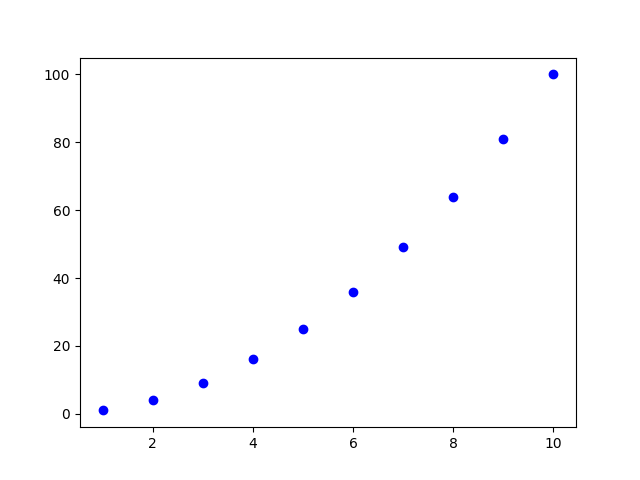
# 红点状图
import numpy as np
import matplotlib.pyplot as plt

x = np.linspace(1, 10, 10)
plt.plot(x, x ** 2, 'r+')
plt.show()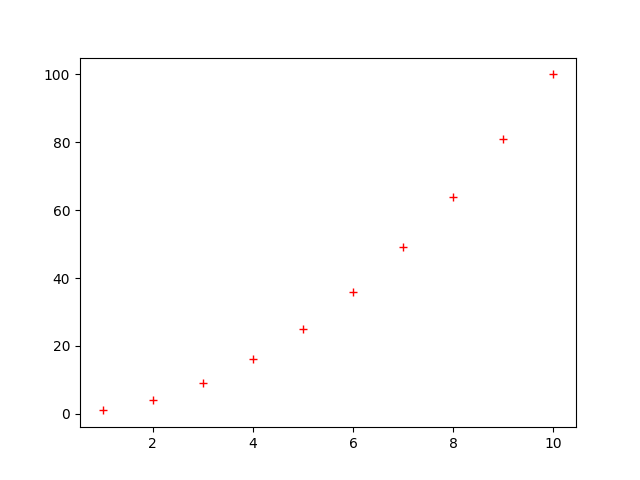
# 包含多条曲线的图
import numpy as np
import matplotlib.pyplot as plt

x = np.linspace(1, 10, 10)
plt.plot(x, x * 2)
plt.plot(x, x / 2)
plt.plot(x, x ** 2)
# 也可以使用plt.plot(x, x * 2, x, x / 2, x, x ** 2)来绘制三条曲线(不推荐)
plt.show()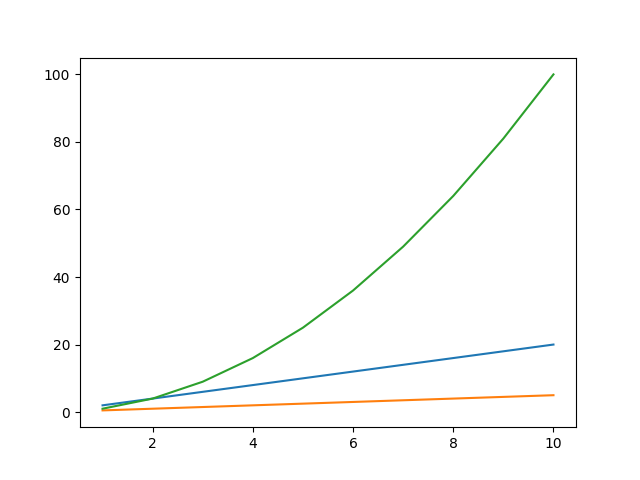
# 开启网格线绘制图形
import numpy as np
import matplotlib.pyplot as plt

x = np.arange(-np.pi, np.pi, 0.01)
plt.plot(x, np.sin(x), x, np.cos(x))
plt.grid(True)  # 开启网格线
plt.show()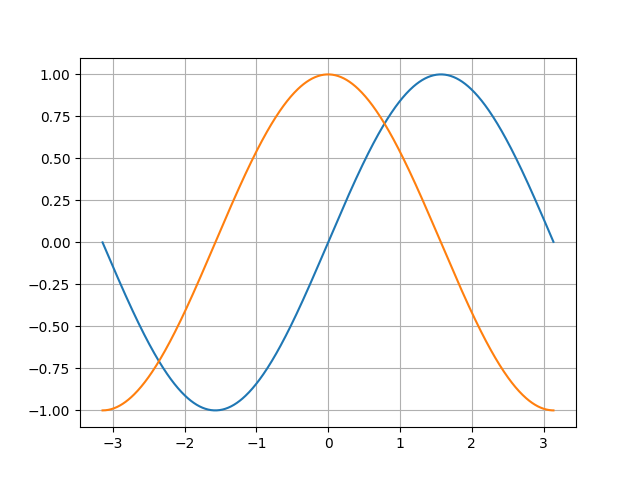
2、图片样式及风格
网格线及子视图
# 创建子视图
import numpy as np
import matplotlib.pyplot as plt

plt.figure(figsize=[15, 7])  # 设置画布大小
axes = plt.subplot(1, 3, 1)  # 创建一个子视图,1行3列1号
x = np.arange(-20, 20, 0.1)
axes.plot(x, np.sin(x))

axes2 = plt.subplot(1, 3, 2)  # 创建第二个子视图
x2 = np.arange(-20, 20, 0.1)
axes2.plot(x, np.sin(x))

axes3 = plt.subplot(1, 3, 3)  # 创建第三个子视图
axes3.plot(x, np.arcsin(x))

plt.show()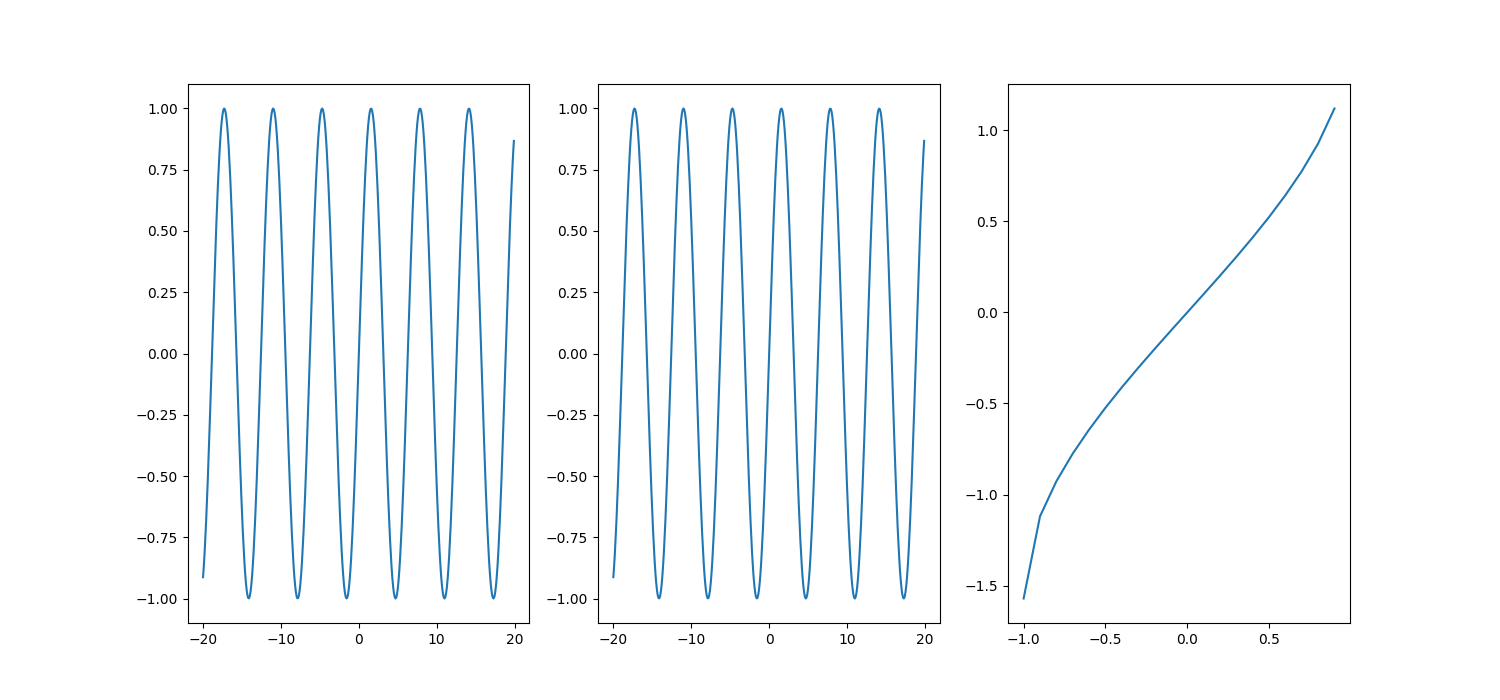
# 修改网格线样式
import numpy as np
import matplotlib.pyplot as plt

plt.figure(figsize=[15, 8])
axes = plt.subplot(1, 3, 1)  # 创建一个子视图
x = np.arange(-20, 20, 0.1)
axes.grid(color='r', linestyle='--', linewidth=2)  # 设置网格颜色、线形、线的宽度
axes.plot(x, np.sin(x))

axes2 = plt.subplot(1, 3, 2)  # 创建第二个子视图
x2 = np.arange(-20, 20, 0.1)
axes2.grid(color='g', linestyle='--')
axes2.plot(x, np.sin(x))

axes3 = plt.subplot(1, 3, 3)  # 创建第三个子视图
axes2.grid(color='blue', linestyle='--')
axes3.plot(x, np.arcsin(x))

plt.show()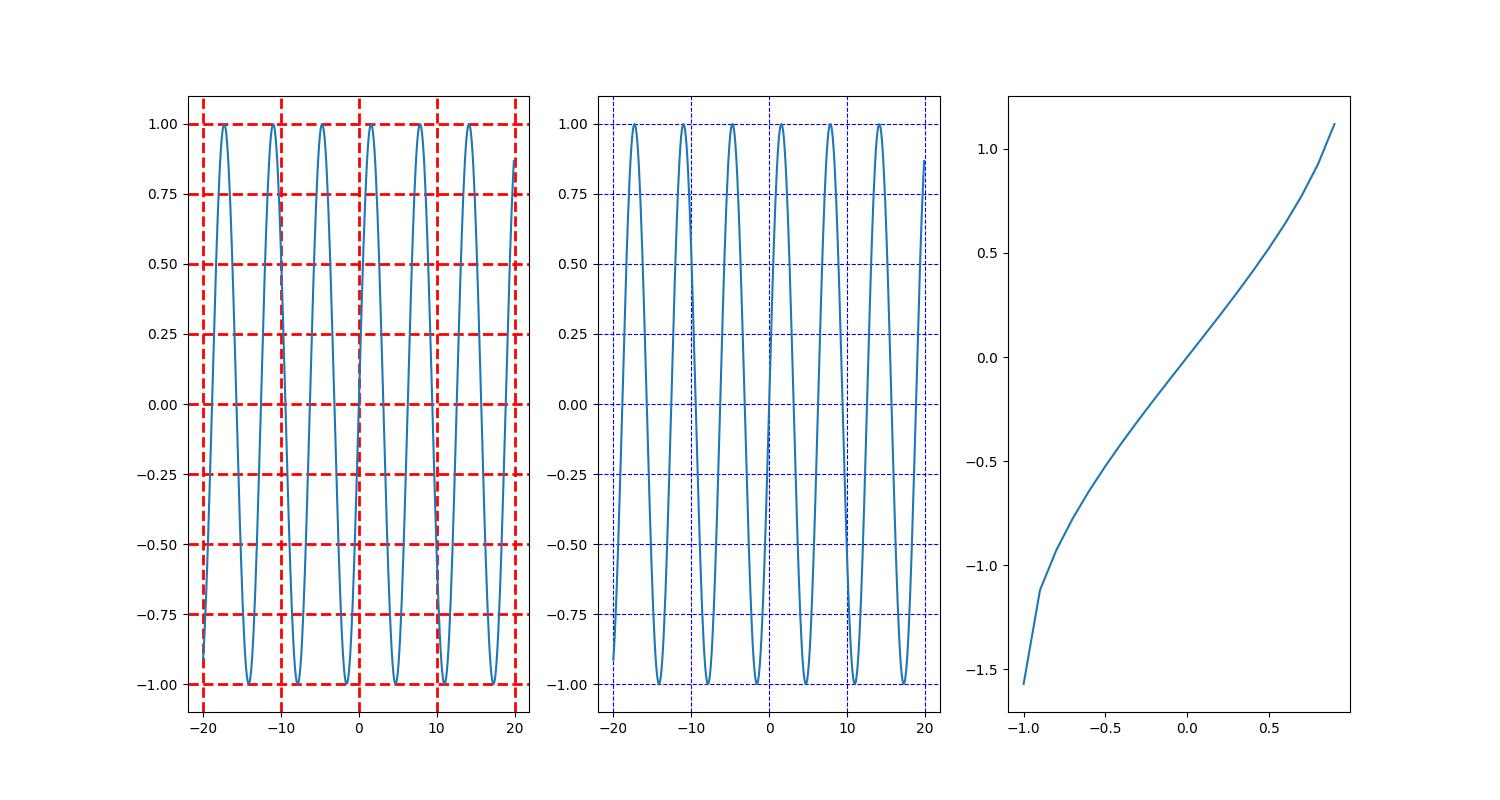
坐标轴界限
# 设置坐标轴界限
import numpy as np
import matplotlib.pyplot as plt

x = np.random.random(10)
plt.axis([-5, 15, -5, 10])  # 设置坐标轴范围[xmin, xmax, ymin, ymax]
# xlim()和ylimit()与上面等效
# plt.xlim(-5, 15)
# plt.ylim(-5, 10)
# plt.axis('off') 关闭坐标轴
plt.plot(x)
plt.show()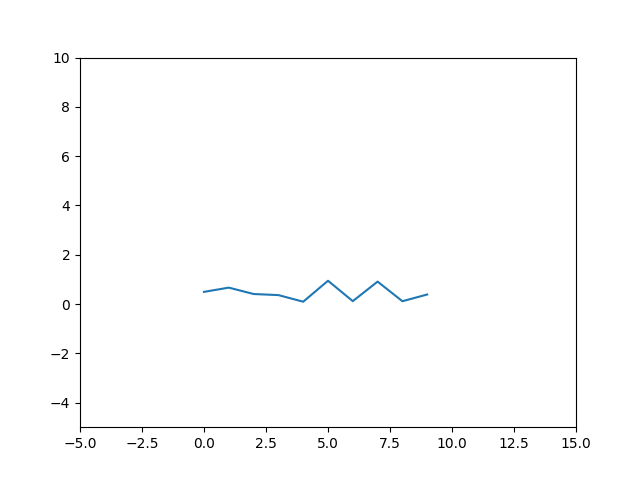
# 画个圆
import numpy as np
import matplotlib.pyplot as plt

x = np.linspace(-5, 5, 100)
plt.plot(np.sin(x), np.cos(x))
plt.axis('equal')
plt.show()
坐标轴的标签
# 设置坐标轴的标题和标签
import numpy as np
import matplotlib.pyplot as plt
from matplotlib import font_manager

x = np.arange(0, 10, 2)
y = x ** 2 + 5
plt.plot(x, y)

my_font = font_manager.FontProperties(family='SimSun', size=20)  # family指定字体(系统内,SimSun宋体),fname可以使用ttf文件路径的字体
plt.title('坐标标签测试图', fontproperties=my_font)  # 设置标题
plt.xlabel('x', size=20)
plt.ylabel('f(x)=x^2+5', size=20, rotation=10)  # rotation为旋转角度
plt.show()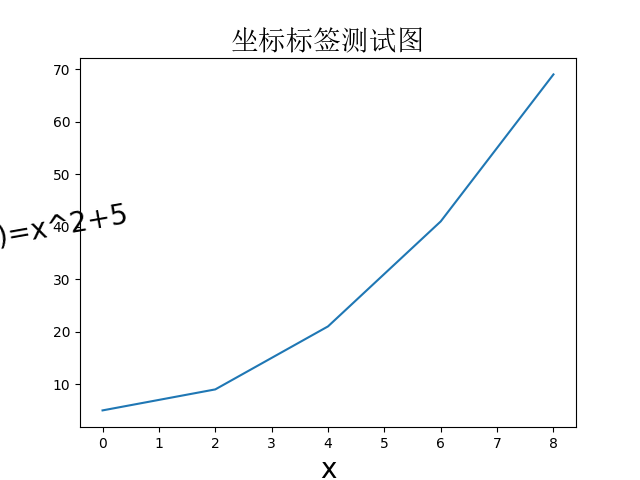
图例
# 图例
import numpy as np
import matplotlib.pyplot as plt

x = np.arange(0, 10, 2)
plt.plot(x, x, label='x')
plt.plot(x, x * 2, label='2x')
plt.plot(x, x ** 2, label='x^2')
plt.legend()  # 创建图例
plt.show()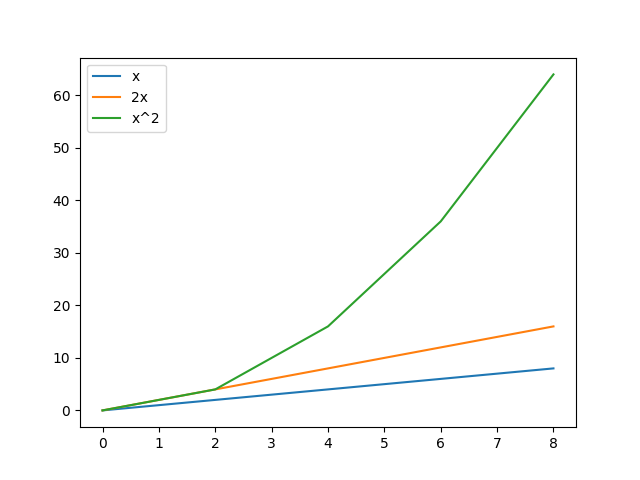
Location String | Location Code |
|---|---|
'best' (Axes only) | 0 |
'upper right' | 1 |
'upper left' | 2 |
'lower left' | 3 |
'lower right' | 4 |
'right' | 5 |
'center left' | 6 |
'center right' | 7 |
'lower center' | 8 |
'upper center' | 9 |
'center' | 10 |
import numpy as np
import matplotlib.pyplot as plt

x = np.arange(0, 10, 2)
plt.plot(x, x)
plt.plot(x, x * 2)
plt.plot(x, x ** 2)
plt.legend(['x', '2x', 'x^2'], loc='right')  # 修改图例位置,参数参考上表
plt.show()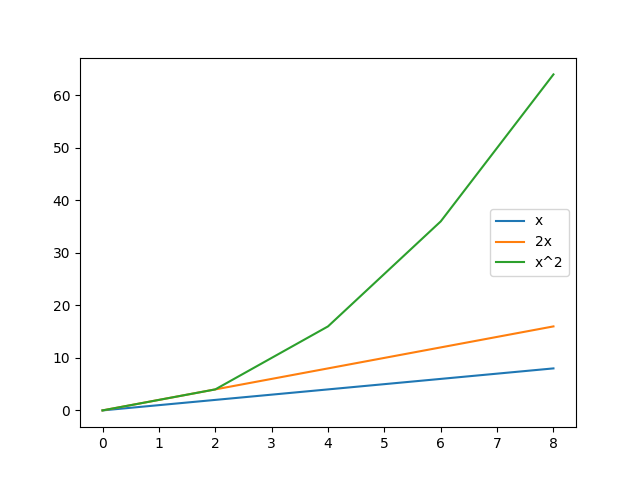
线条样式
import numpy as np
import matplotlib.pyplot as plt

x1 = np.random.randn(100)
x2 = np.random.randn(100)
x3 = np.random.randn(100)

plt.plot(x1.cumsum(), color='blue', linestyle='--', marker='o')
plt.plot(x2.cumsum(), color='green', linestyle='-', marker='>')
plt.plot(x3.cumsum(), color='black', linestyle=':', marker='D')

plt.legend(['x1', 'x2', 'x3'])
plt.savefig('./pic.jpg', dpi=150)  # 保存图片,可使用facecolor自定义背景颜色
plt.show()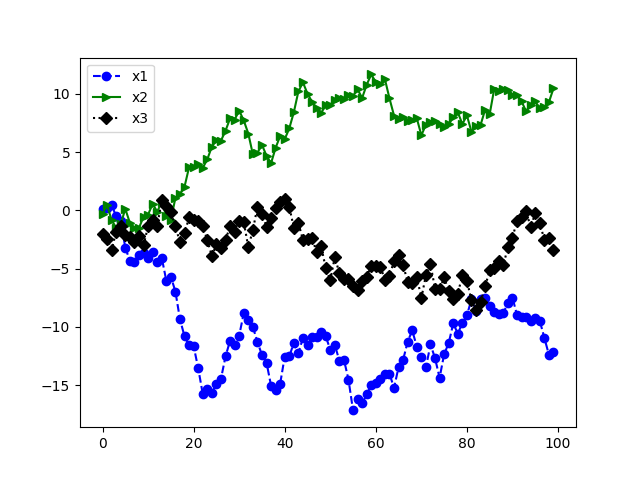
import numpy as np
import matplotlib.pyplot as plt

x = np.arange(0, 10, 0.1)

axes = plt.subplot(facecolor='pink')
axes.plot(x, np.sin(x), color='green',  # 线条颜色
          alpha=0.3,  # 0~1之间的透明度
          ls='-',  # 线形状,与linestyle等效
          lw=10  # 线条宽度与linewidth等效
          )
plt.show()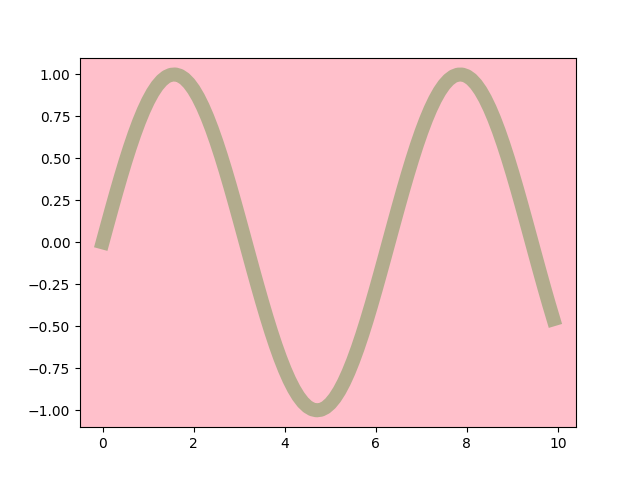
坐标轴刻度
# 坐标刻度样式
import numpy as np
import matplotlib.pyplot as plt

x = np.random.randn(100)
plt.plot(x.cumsum())

plt.xticks(np.linspace(1, 100, 7), list('ABCDEFG'), rotation=90)
plt.yticks(np.linspace(-10, 20, 3), ['min', 0, 'max'], fontsize=15)
plt.show()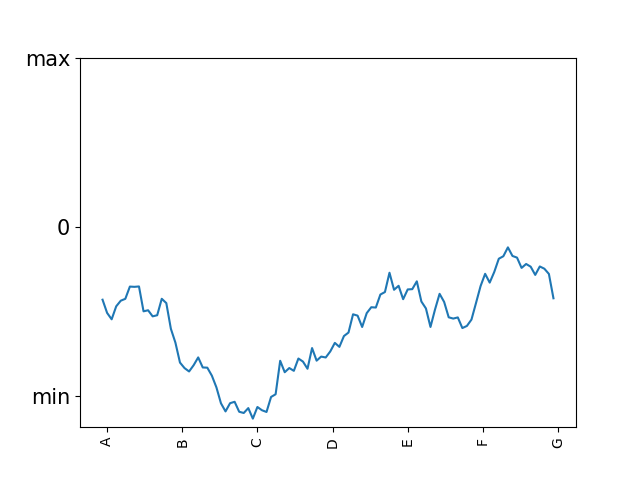
3、函数图像绘制
# 获知sinx、cosx和sqrt(x)
import numpy as np
import matplotlib.pyplot as plt
from matplotlib import rcParams

# 全局字体
config = {
    "mathtext.fontset": 'stix',
    "font.family": 'serif',
    "font.serif": ['Times New Roman'],  # 字体
    "font.size": 22,
    'axes.unicode_minus': False  # 处理负号,即-号
}
rcParams.update(config)
# 设置画布按大小
plt.figure(figsize=(10, 6))
# 数据内容
x = np.arange(0, 10, 0.2)
y1 = np.sin(x)
y2 = np.cos(x)
y3 = np.sqrt(x)
# 绘制数据
plt.plot(x, y1, color='darkseagreen', lw=1, ls='-', marker='.', label='$y=sinx$')
plt.plot(x, y2, color='dodgerblue', lw=1, ls='-', marker='*', label='$y=cosx$')
plt.plot(x, y3, color='orchid', lw=1, ls='-', marker='3', label='$y=\sqrt{x}$')
# 限制横纵坐标范围
plt.xlim((0, 10.5))
plt.ylim((-1.5, 4))
# 添加子图来修改坐标轴位置
ax = plt.subplot(1, 1, 1)
ax.spines['right'].set_color('none')
ax.spines['top'].set_color('none')
ax.spines['bottom'].set_position(('data', 0))
ax.spines['left'].set_position(('data', 0))

x0 = 8
y0 = 2 * np.sqrt(2)
# 绘制2根2的点
plt.plot(x0, y0, marker='o', color='orchid')
# 添加箭头及文字
plt.annotate('$2\sqrt{2}$', xy=(x0, y0),
             textcoords='offset points', xytext=(+10, -30), fontsize=16,
             arrowprops=dict(arrowstyle='->', connectionstyle='arc3,rad=0'))
# 添加xy的范围文字
plt.annotate('$x\in[0.0,10.0]$\n$y\in[-1.0,4.0]$', xy=(3.8, 2), fontsize=16,
             textcoords='offset points', xytext=(+10, -30))

# 开启网格线
plt.grid()
# 设置图例
plt.legend(numpoints=2, fontsize=14)
plt.title('the function figure of cos(), sin() and sqrt()')
# 修改x轴文字距离x轴的距离
plt.xlabel('the input value of x', labelpad=80)
# 修改y轴的旋转度数
plt.ylabel('y=f(x)', rotation=90)
plt.show()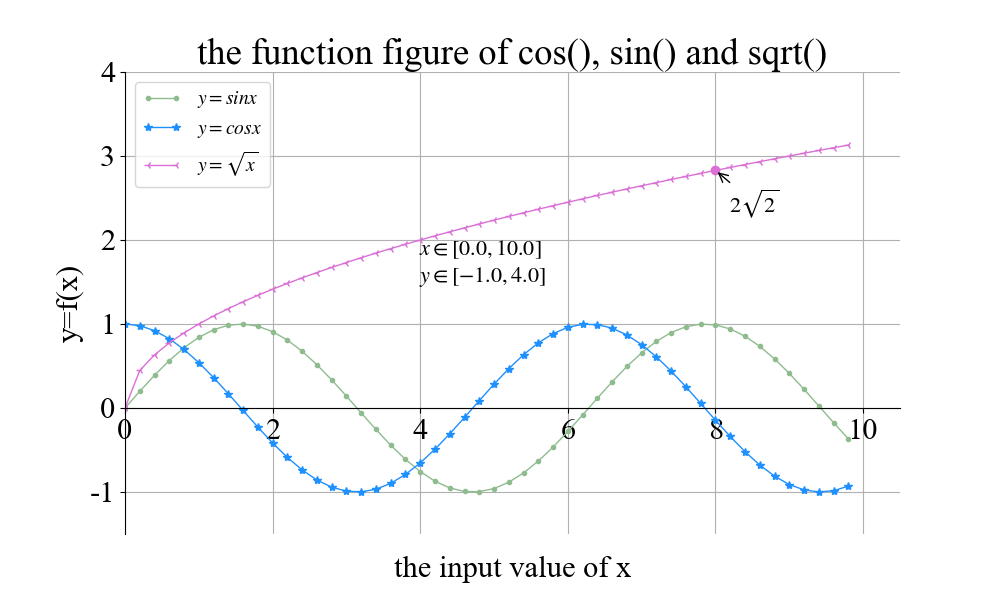
4、其他图形样式
直方图
import numpy as np
import matplotlib.pyplot as plt

x = np.random.randint(0, 10, 10)
plt.hist(x, density=True, orientation='horizontal', color='red')
plt.show()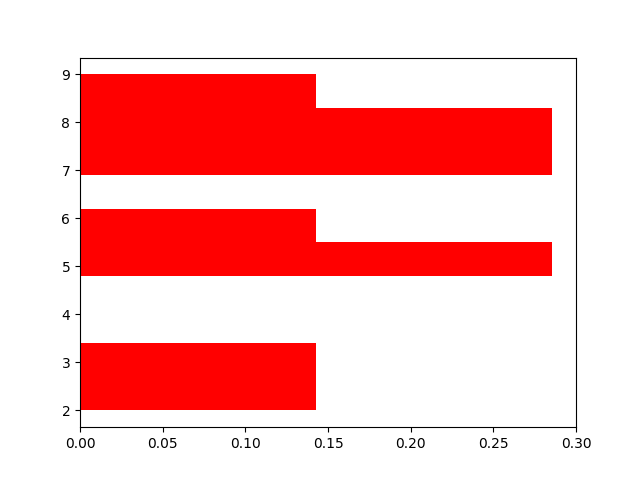
条形图
import numpy as np
import matplotlib.pyplot as plt

x = np.linspace(0, 5, 5)
y = np.random.randint(0, 20, size=5)
# plt.bar(x, y) 竖直方向
plt.barh(x, y)
plt.show()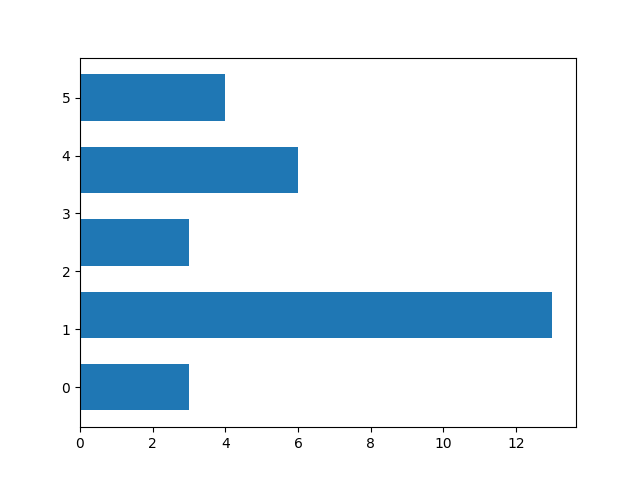
饼图
import numpy as np
import matplotlib.pyplot as plt

p = np.array([0.4, 0.2, 0.15, 0.15, 0.1])
plt.pie(p, labels=['b', 'b', 'c', 'd', 'e'], autopct='%.2f%%')
plt.show()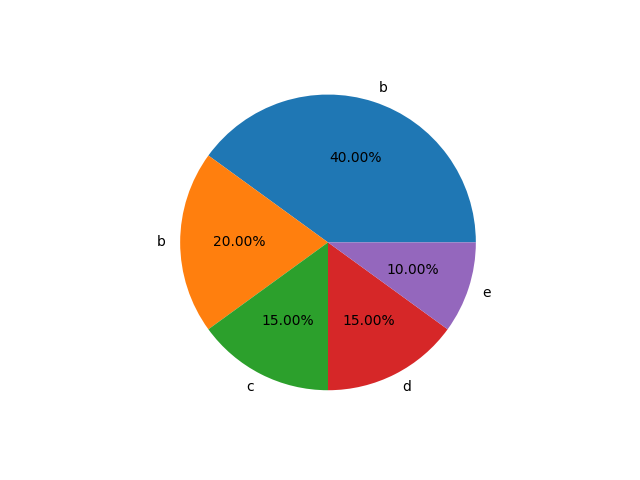
散点图
import numpy as np
import matplotlib.pyplot as plt

x = np.random.randn(1000)
y = np.random.randn(1000)
plt.scatter(x, y, color='r', s=18)
plt.show()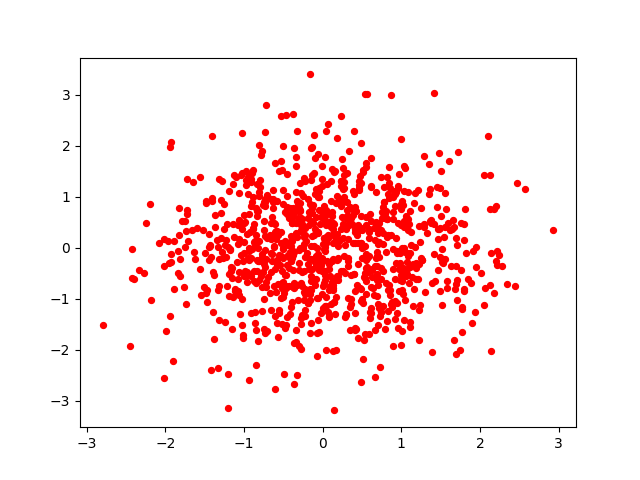
箱型图
import numpy as np
import matplotlib.pyplot as plt
import pandas as pd

df = pd.DataFrame(np.random.rand(10, 5))
plt.boxplot(df)
plt.show()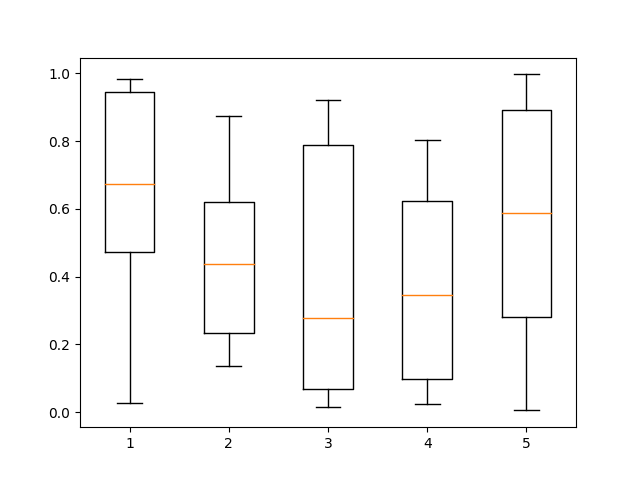
小提琴图
import numpy as np
import matplotlib.pyplot as plt

plt.violinplot(dataset=np.random.normal(size=1000))
plt.show()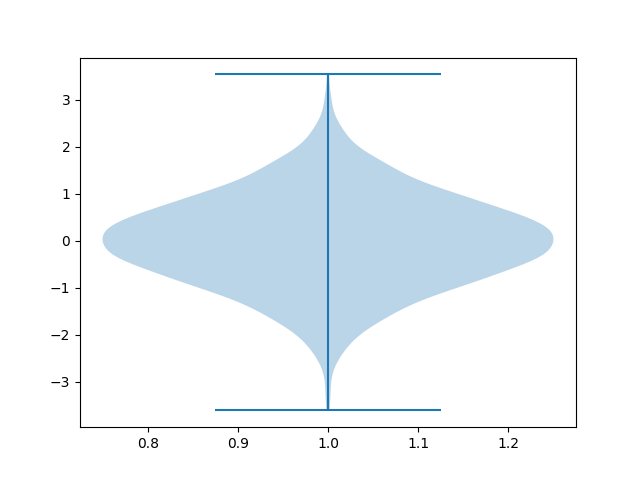
三、根据数据集绘制图像
1、2000年以前温室气体浓度
# 根据csv绘制图像
import os
import requests
import numpy as np
import pandas as pd
import matplotlib.pyplot as plt
from matplotlib import font_manager

# 数据准备
isExist = os.path.exists('./greenhouse_gases.csv')
if not isExist:
    url = 'https://vincentarelbundock.github.io/Rdatasets/csv/dslabs/greenhouse_gases.csv'
    open('./greenhouse_gases.csv', 'wb').write(requests.get(url).content)

# 设置画布按大小
plt.figure(figsize=(15, 10))
# 设置字体
title_font = font_manager.FontProperties(family='SimHei', size=25)  # SimHei黑体
label_font = font_manager.FontProperties(family='SimHei', size=15)

# 读取温室气体浓度数据
gas_data = pd.read_csv('./greenhouse_gases.csv')
# 数据根据气体分组
gas_group = gas_data.groupby(by='gas', sort=True)
gas_list = gas_data['gas'].unique()
for gas in gas_list:
    gas_data_by_type = gas_group.get_group(gas)
    # 年份和浓度数据
    year_list = gas_data_by_type['year']
    year_list = ['{}年'.format(y) for y in year_list]
    concentration_list = gas_data_by_type['concentration']
    # 绘制图像
    line = np.linspace(1, len(concentration_list), len(concentration_list))
    plt.plot(line, concentration_list, label=gas)
    # 修改x轴坐标数值
    plt.xticks(np.arange(1, 100, step=10), year_list[::int(len(year_list) / 10)], fontsize=15, fontproperties=label_font)
    plt.yticks(fontsize=15, fontproperties=label_font)

# 开启网格线
plt.grid()
# 设置标题
plt.title('2000年以前温室气体浓度趋势图', fontproperties=title_font)
# 创建图例并绘制图像
plt.legend(fontsize=15)
plt.show()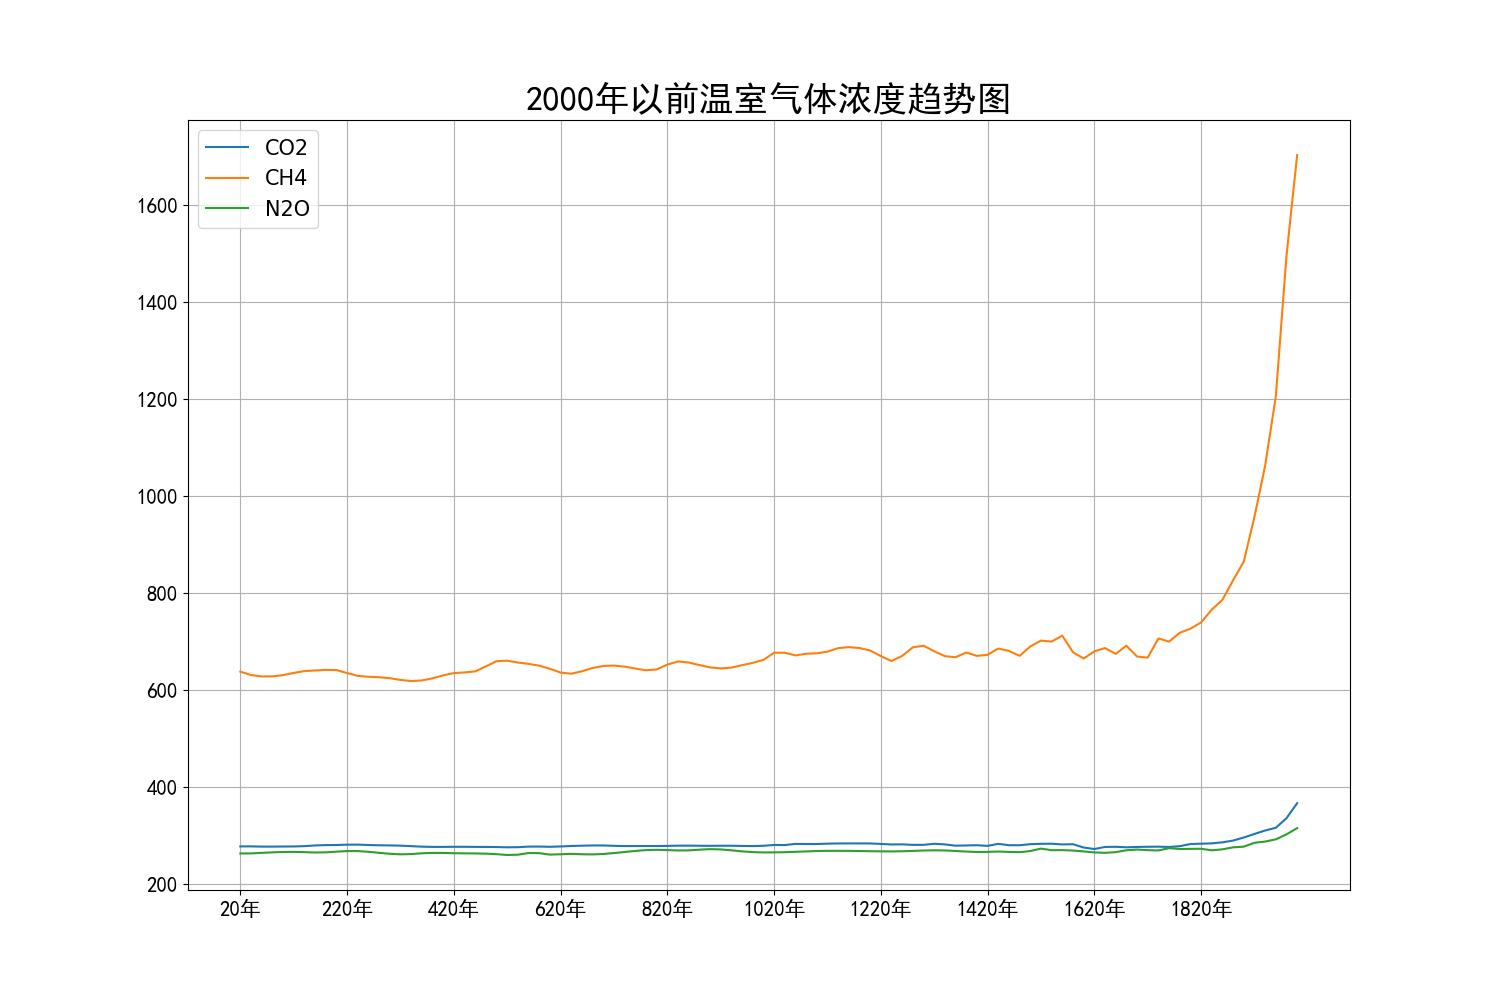
2、2013年纽约起飞的所有航班准点率
数据含义描述
Flights data
Description
On-time data for all flights that departed NYC (i.e. JFK, LGA or EWR) in 2013.
Usage
flights
Format
Data frame with columns
year, month, day : Date of departure.
dep_time, arr_time : Actual departure and arrival times (format HHMM or HMM), local tz.
sched_dep_time, sched_arr_time : Scheduled departure and arrival times (format HHMM or HMM), local tz.
dep_delay, arr_delay : Departure and arrival delays, in minutes. Negative times represent early departures/arrivals.
carrier : Two letter carrier abbreviation. See airlines to get name.
flight : Flight number.
tailnum : Plane tail number. See planes for additional metadata.
origin, dest : Origin and destination. See airports for additional metadata.
air_time : Amount of time spent in the air, in minutes.
distance : Distance between airports, in miles.
hour, minute : Time of scheduled departure broken into hour and minutes.
time_hour : Scheduled date and hour of the flight as a POSIXct date. Along with origin, can be used to join flights data to weather data.
Source
RITA, Bureau of transportation statistics, https://www.transtats.bts.gov/DL_SelectFields.asp?Table_ID=236
数据内容查看
import pandas as pd

# 读取航班的准点率数据
flights_data = pd.read_csv('./flights.csv')
# 不省略数据列
pd.set_option('display.max_columns', None)
# 查看数据基本信息
print('top 5 data: \n', flights_data.head(5), end='\n' + '-' * 80 + '\n')
print('data info : \n', flights_data.info(), end='\n' + '-' * 80 + '\n')
print('data describe : \n', flights_data.describe())

''' 输出:
top 5 data:
    Unnamed: 0  year  month  day  dep_time  sched_dep_time  dep_delay
0           1  2013      1    1     517.0             515        2.0  \
1           2  2013      1    1     533.0             529        4.0
2           3  2013      1    1     542.0             540        2.0
3           4  2013      1    1     544.0             545       -1.0
4           5  2013      1    1     554.0             600       -6.0

   arr_time  sched_arr_time  arr_delay carrier  flight tailnum origin dest
0     830.0             819       11.0      UA    1545  N14228    EWR  IAH  \
1     850.0             830       20.0      UA    1714  N24211    LGA  IAH
2     923.0             850       33.0      AA    1141  N619AA    JFK  MIA
3    1004.0            1022      -18.0      B6     725  N804JB    JFK  BQN
4     812.0             837      -25.0      DL     461  N668DN    LGA  ATL

   air_time  distance  hour  minute            time_hour
0     227.0      1400     5      15  2013-01-01 05:00:00
1     227.0      1416     5      29  2013-01-01 05:00:00
2     160.0      1089     5      40  2013-01-01 05:00:00
3     183.0      1576     5      45  2013-01-01 05:00:00
4     116.0       762     6       0  2013-01-01 06:00:00
--------------------------------------------------------------------------------
<class 'pandas.core.frame.DataFrame'>
RangeIndex: 336776 entries, 0 to 336775
Data columns (total 20 columns):
 #   Column          Non-Null Count   Dtype
---  ------          --------------   -----
 0   Unnamed: 0      336776 non-null  int64
 1   year            336776 non-null  int64
 2   month           336776 non-null  int64
 3   day             336776 non-null  int64
 4   dep_time        328521 non-null  float64
 5   sched_dep_time  336776 non-null  int64
 6   dep_delay       328521 non-null  float64
 7   arr_time        328063 non-null  float64
 8   sched_arr_time  336776 non-null  int64
 9   arr_delay       327346 non-null  float64
 10  carrier         336776 non-null  object
 11  flight          336776 non-null  int64
 12  tailnum         334264 non-null  object
 13  origin          336776 non-null  object
 14  dest            336776 non-null  object
 15  air_time        327346 non-null  float64
 16  distance        336776 non-null  int64
 17  hour            336776 non-null  int64
 18  minute          336776 non-null  int64
 19  time_hour       336776 non-null  object
dtypes: float64(5), int64(10), object(5)
memory usage: 51.4+ MB
data info :
 None
--------------------------------------------------------------------------------
data describe :
           Unnamed: 0      year          month            day       dep_time
count  336776.000000  336776.0  336776.000000  336776.000000  328521.000000  \
mean   168388.500000    2013.0       6.548510      15.710787    1349.109947
std     97219.001466       0.0       3.414457       8.768607     488.281791
min         1.000000    2013.0       1.000000       1.000000       1.000000
25%     84194.750000    2013.0       4.000000       8.000000     907.000000
50%    168388.500000    2013.0       7.000000      16.000000    1401.000000
75%    252582.250000    2013.0      10.000000      23.000000    1744.000000
max    336776.000000    2013.0      12.000000      31.000000    2400.000000

       sched_dep_time      dep_delay       arr_time  sched_arr_time
count   336776.000000  328521.000000  328063.000000   336776.000000  \
mean      1344.254840      12.639070    1502.054999     1536.380220
std        467.335756      40.210061     533.264132      497.457142
min        106.000000     -43.000000       1.000000        1.000000
25%        906.000000      -5.000000    1104.000000     1124.000000
50%       1359.000000      -2.000000    1535.000000     1556.000000
75%       1729.000000      11.000000    1940.000000     1945.000000
max       2359.000000    1301.000000    2400.000000     2359.000000

           arr_delay         flight       air_time       distance
count  327346.000000  336776.000000  327346.000000  336776.000000  \
mean        6.895377    1971.923620     150.686460    1039.912604
std        44.633292    1632.471938      93.688305     733.233033
min       -86.000000       1.000000      20.000000      17.000000
25%       -17.000000     553.000000      82.000000     502.000000
50%        -5.000000    1496.000000     129.000000     872.000000
75%        14.000000    3465.000000     192.000000    1389.000000
max      1272.000000    8500.000000     695.000000    4983.000000

                hour         minute
count  336776.000000  336776.000000
mean       13.180247      26.230100
std         4.661316      19.300846
min         1.000000       0.000000
25%         9.000000       8.000000
50%        13.000000      29.000000
75%        17.000000      44.000000
max        23.000000      59.000000
'''
机场航班数量(条形图)
adict.py:
# 不保证信息准确性
carrier_dict = {'UA': {'name_ch': '美国联合航空'}, 'AA': {'name_ch': '美国航空'}, 'B6': {'name_ch': '捷蓝航空'},
                'DL': {'name_ch': '达美航空'}, 'EV': {'name_ch': '美国快捷航空'}, 'MQ': {'name_ch': '特使航空'},
                'US': {'name_ch': '美孟航空'}, 'WN': {'name_ch': '美国西南航空'}, 'VX': {'name_ch': '维珍航空'},
                'FL': {'name_ch': '法国航空'}, 'AS': {'name_ch': 'FLY LILI'}, '9E': {'name_ch': '奋进航空'},
                'F9': {'name_ch': '边疆航空'}, 'HA': {'name_ch': '哈亚航空'}, 'YV': {'name_ch': '梅萨航空公司'},
                'OO': {'name_ch': '天西航空'}}

airport_code = {'EWR': {'name_ch': '纽瓦克自由国际机场'}, 'LGA': {'name_ch': '拉瓜迪亚机场'},
                'JFK': {'name_ch': '纽约肯尼迪机场'}, 'IAH': {'name_ch': '乔治布什国际机场'},
                'MIA': {'name_ch': '迈阿密国际机场'}, 'BQN': {'name_ch': '拉斐尔-埃尔南德斯机场'},
                'ATL': {'name_ch': '亚特兰大国际机场'}, 'ORD': {'name_ch': '奥黑尔国际机场'},
                'FLL': {'name_ch': '劳德代尔机场'}, 'IAD': {'name_ch': '华盛顿杜勒斯国际机场'},
                'MCO': {'name_ch': '奥兰多国际机场'}, 'PBI': {'name_ch': '西棕榈滩国际机场'},
                'TPA': {'name_ch': '坦帕机场'}, 'LAX': {'name_ch': '洛杉矶机场'}, 'SFO': {'name_ch': '旧金山机场'},
                'DFW': {'name_ch': '达拉斯-沃斯堡国际机场'}, 'BOS': {'name_ch': '洛干国际机场'},
                'LAS': {'name_ch': '麦克卡兰国际机场'}, 'MSP': {'name_ch': '圣保罗国际机场'},
                'DTW': {'name_ch': '维纳郡机场'}, 'RSW': {'name_ch': '西南佛罗里达地区机场'},
                'SJU': {'name_ch': '路易斯姆诺兹马灵机场'}, 'PHX': {'name_ch': '凤凰城机场'},
                'BWI': {'name_ch': '巴尔的摩华盛顿国际机场'}, 'CLT': {'name_ch': '夏洛特-道格拉斯国际机场'},
                'BUF': {'name_ch': '布法罗尼亚加拉国际机场'}, 'DEN': {'name_ch': '丹佛国际机场'},
                'SNA': {'name_ch': '约翰维纳机场'}, 'MSY': {'name_ch': '新奥尔良路易斯阿姆斯特朗国际机场'},
                'SLC': {'name_ch': '盐湖城国际机场'}, 'XNA': {'name_ch': '阿肯色西北地区机场'},
                'MKE': {'name_ch': '米切尔国际机场'}, 'SEA': {'name_ch': '西雅图塔克马国际机场'},
                'ROC': {'name_ch': '罗切斯特机场'}, 'SYR': {'name_ch': '雪城汉考克国际机场'},
                'SRQ': {'name_ch': '布雷登顿国际机场'}, 'RDU': {'name_ch': '罗利机场'},
                'CMH': {'name_ch': '哥伦布国际机场'}, 'JAX': {'name_ch': '杰克逊威尔机场'},
                'CHS': {'name_ch': '查尔斯顿国际机场'}, 'MEM': {'name_ch': '孟菲斯机场'},
                'PIT': {'name_ch': '匹兹堡机场'}, 'SAN': {'name_ch': '圣迭戈国际机场'},
                'DCA': {'name_ch': '罗纳德·里根华盛顿国家机场'}, 'CLE': {'name_ch': '霍普金斯国际机场'},
                'STL': {'name_ch': '兰伯特圣路易斯国际机场'}, 'MYR': {'name_ch': '默特尔比奇国际机场'},
                'JAC': {'name_ch': '杰克逊霍勒机场'}, 'MDW': {'name_ch': '米德威机场'},
                'HNL': {'name_ch': '火奴鲁鲁国际机场'}, 'BNA': {'name_ch': '那什维尔国际机场'},
                'AUS': {'name_ch': '奥斯汀机场'}, 'BTV': {'name_ch': '柏林顿机场'}, 'PHL': {'name_ch': '费城国际机场'},
                'STT': {'name_ch': '圣托马斯机场'}, 'EGE': {'name_ch': '伊格尔郡机场'},
                'AVL': {'name_ch': '阿什维尔地区机场'}, 'PWM': {'name_ch': '波特兰国际喷气机机场'},
                'IND': {'name_ch': '印第安纳波利斯机场'}, 'SAV': {'name_ch': '希尔顿首脑机场'},
                'CAK': {'name_ch': '阿克伦坎通地区机场'}, 'HOU': {'name_ch': '霍比机场'},
                'LGB': {'name_ch': '长滩地方机场'}, 'DAY': {'name_ch': '詹姆斯考克斯代顿机场'},
                'ALB': {'name_ch': '奥尔巴尼国际机场'}, 'BDL': {'name_ch': '布拉德利国际机场'},
                'MHT': {'name_ch': '曼彻斯特地方机场'}, 'MSN': {'name_ch': '麦迪逊机场'},
                'GSO': {'name_ch': '格林斯伯勒机场'}, 'CVG': {'name_ch': '辛辛那提国际机场'},
                'BUR': {'name_ch': '伯班克机场'}, 'RIC': {'name_ch': '里士满国际机场'},
                'GSP': {'name_ch': '格林威尔机场'}, 'GRR': {'name_ch': '肯特郡国际机场'},
                'MCI': {'name_ch': '堪萨斯城国际机场'}, 'ORF': {'name_ch': '诺福克国际机场'},
                'SAT': {'name_ch': '圣安东尼奥机场'}, 'SDF': {'name_ch': '路易斯威尔机场'},
                'PDX': {'name_ch': '波特兰国际机场'}, 'SJC': {'name_ch': '圣何塞地方机场'},
                'OMA': {'name_ch': '奥马哈机场'}, 'CRW': {'name_ch': '查尔斯顿耶格机场'},
                'OAK': {'name_ch': '奥克兰大都会国际机场'}, 'SMF': {'name_ch': '萨克拉门托大都会机场'},
                'TUL': {'name_ch': '塔尔萨国际机场'}, 'TYS': {'name_ch': '麦克吉提森机场'},
                'OKC': {'name_ch': '维尔罗杰斯机场'}, 'PVD': {'name_ch': '西奥多·弗朗西斯·格林机场'},
                'DSM': {'name_ch': '得梅因机场'}, 'PSE': {'name_ch': '梅塞德塔国际机场'},
                'BHM': {'name_ch': '伯明翰-沙特尔斯沃思国际机场'}, 'CAE': {'name_ch': '哥伦比亚机场'},
                'HDN': {'name_ch': '亚姆帕瓦雷机场'}, 'BZN': {'name_ch': '加拉丁机场'},
                'MTJ': {'name_ch': '蒙特罗斯郡机场'}, 'EYW': {'name_ch': '基韦斯特国际机场'},
                'PSP': {'name_ch': '帕姆斯普林斯地方机场'}, 'ACK': {'name_ch': '南塔克特纪念机场'},
                'BGR': {'name_ch': '班戈国际机场'}, 'ABQ': {'name_ch': '阿尔伯克基国际机场'},
                'ILM': {'name_ch': '威尔明顿国际机场'}, 'MVY': {'name_ch': '马撒葡萄园岛机场'},
                'SBN': {'name_ch': '南本德地区机场'}, 'LEX': {'name_ch': '布鲁格拉斯机场'},
                'CHO': {'name_ch': '夏洛茨维尔机场'}, 'TVC': {'name_ch': '特拉佛斯城机场'},
                'ANC': {'name_ch': '安克雷奇国际机场'}}
import numpy as np
import pandas as pd
import matplotlib.pyplot as plt
from matplotlib import rcParams
import adict
# 设置画布按大小
plt.figure(figsize=(15, 10))
# 全局字体
config = {
"mathtext.fontset": 'stix',
"font.family": 'serif',
"font.serif": ['KaiTi'], # 楷体
"font.size": 20,
'axes.unicode_minus': False # 处理负号,即-号
}
rcParams.update(config)
# 调整图形边距
plt.subplots_adjust(top=0.9, bottom=0.28)
# 读取航班的准点率数据
flights_data = pd.read_csv('./flights.csv')
flights_data.set_index('Unnamed: 0', inplace=True)
# 新增count列
flights_data.loc[:, 'count'] = pd.Series(np.ones(len(flights_data.index)))
# 过滤空数据(过滤行中包含NA的数据)
# 对行中某列/某几列的过滤
# flights_data = flights_data[flights_data.dep_time.notnull()]
flights_data = flights_data.dropna() # 行中任意包含NA的过滤
# 仅留下origin, dest, count三列
flights_data = flights_data.loc[:, ['origin', 'dest', 'count']]
# 根据origin进行分组
flights_group = flights_data.groupby('origin', sort=True)
origin_arr = flights_data['origin'].unique()
# 初始化count_dict
count_dict = {}
for i in origin_arr:
count_dict[i] = []
# 分别统计这些目的地的航班量
dest_arr = [des for des in adict.airport_code][3:13] # 筛选部分目的地
for ori in origin_arr:
group_by_ori = flights_group.get_group(ori)
group_by_ori = group_by_ori[group_by_ori['dest'].isin(dest_arr)]
group_by_ori = group_by_ori.groupby(['origin', 'dest'], sort=True)
count_by_ori = group_by_ori.count()
for des in dest_arr:
if (ori, des) in count_by_ori.index:
count_dict[ori].append(count_by_ori.loc[(ori, des)]['count'])
else:
count_dict[ori].append(0)
deviation = -0.25
for ori in origin_arr:
plt.bar(np.arange(len(dest_arr)) + deviation, np.array(count_dict[ori]), 0.25,
label=adict.airport_code[ori]['name_ch'])
deviation += 0.25
plt.xticks(np.arange(len(dest_arr)),
[adict.airport_code[des]['name_ch'] for des in dest_arr],
rotation=55, ha='right')
plt.title('2013年纽约三大机场飞往各机场的航班数量图', fontsize=25)
plt.legend()
plt.show()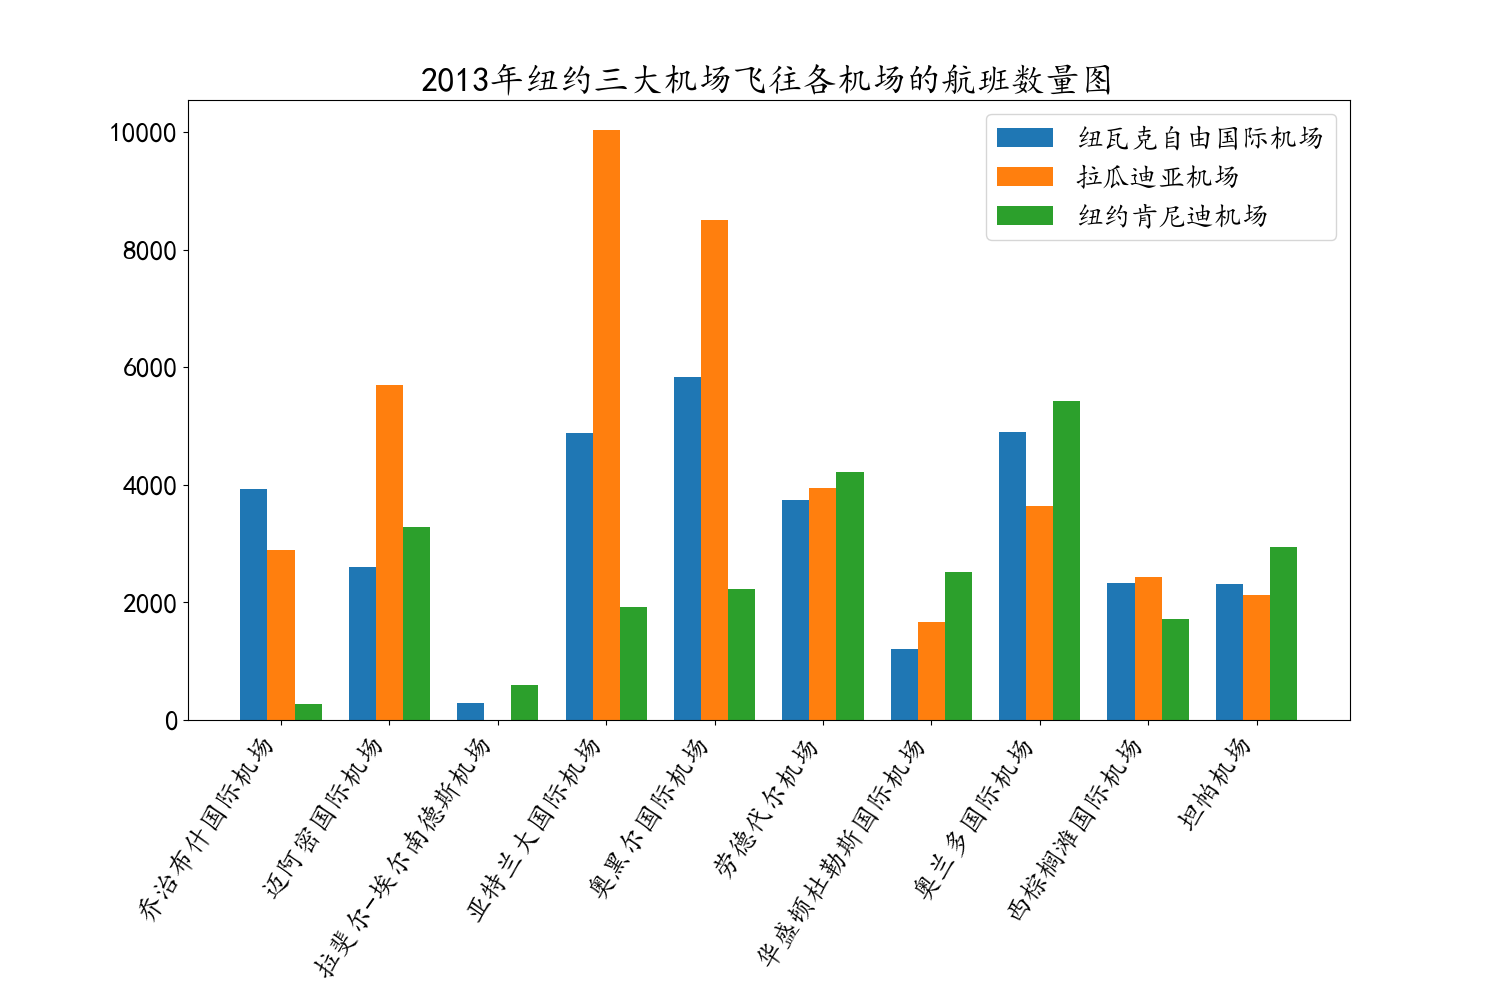
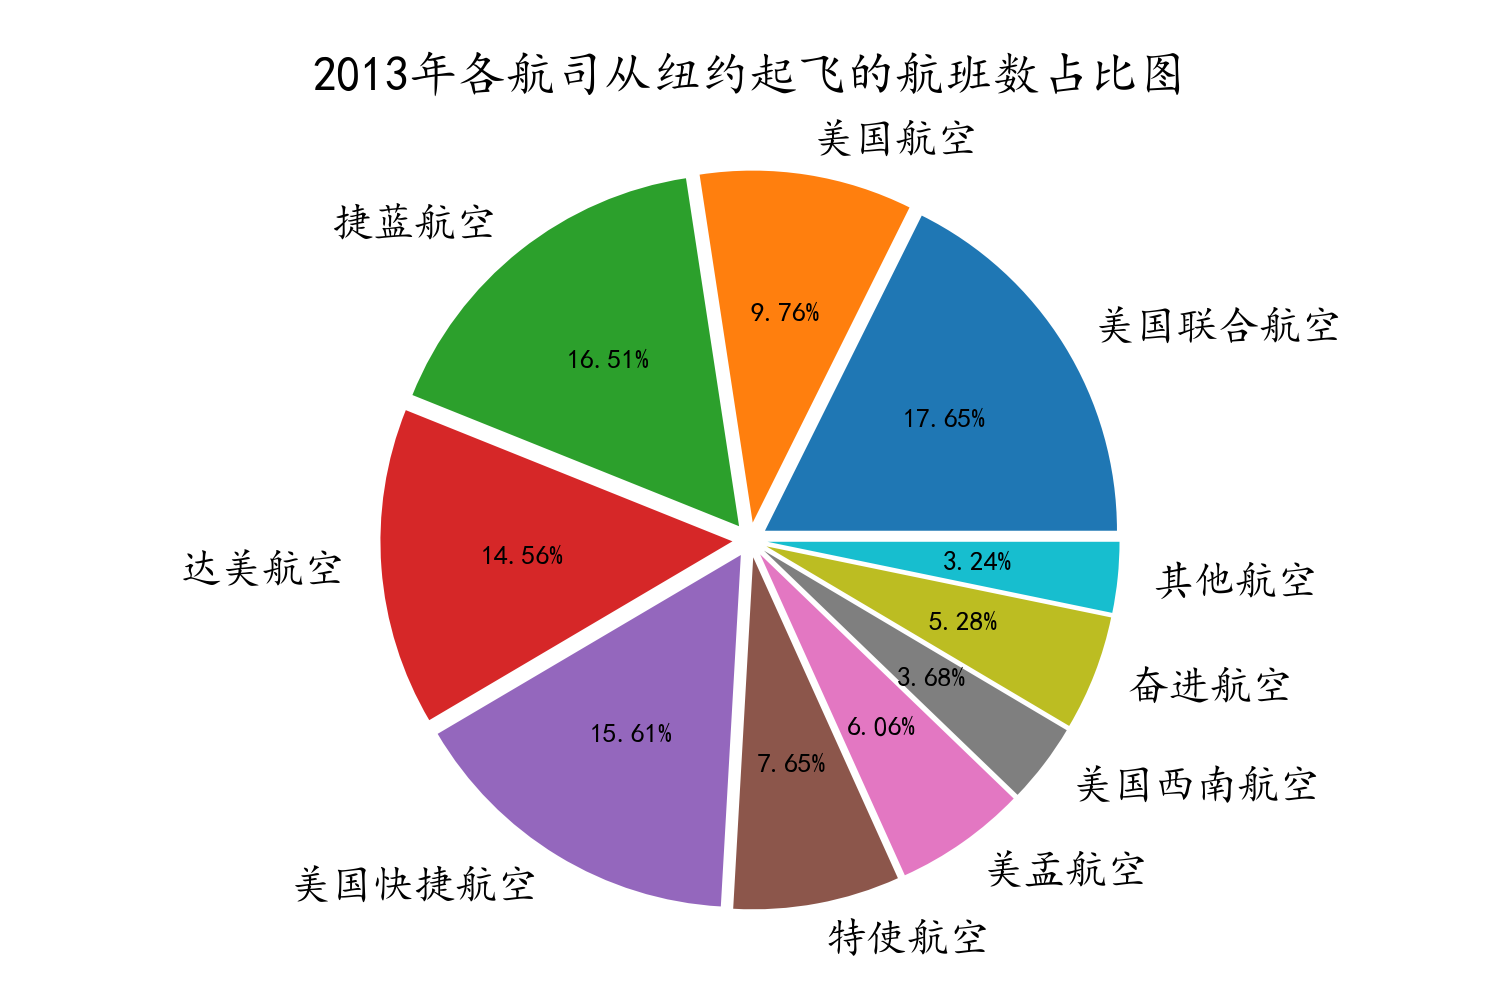
各航司航班数量占比(饼图)
import numpy as np
import pandas as pd
import matplotlib.pyplot as plt
from matplotlib import rcParams

import adict

# 设置画布按大小
plt.figure(figsize=(15, 10))
# 全局字体
config = {
    "mathtext.fontset": 'stix',
    "font.family": 'serif',
    "font.serif": ['KaiTi'],  # 楷体
    "font.size": 30,
    'axes.unicode_minus': False  # 处理负号,即-号
}
rcParams.update(config)
# 调整图形边距
plt.subplots_adjust(left=0.1, right=0.9, top=0.9, bottom=0.02)

# 读取航班的准点率数据
flights_data = pd.read_csv('./flights.csv')
flights_data.set_index('Unnamed: 0', inplace=True)
# 新增count列
flights_data.loc[:, 'count'] = pd.Series(np.ones(len(flights_data.index)))
# 过滤空数据(过滤行中包含NA的数据)
flights_data = flights_data.dropna()

carrier_list = flights_data['carrier'].unique()
flights_group = flights_data.groupby('carrier', sort=False)
# 仅留下origin, dest, count三列
flights_data = flights_data.loc[:, ['carrier', 'count']]
# 数据整理
data_list = []
carrier_ch_list = [adict.carrier_dict.get(ca)['name_ch'] for ca in carrier_list]
for carrier in carrier_list:
    flights_group_by_carrier = flights_group.get_group(carrier)
    data_list.append(flights_group_by_carrier.count()['count'])

# 统一比例过小的数据为其他
other_sum = 0
data_list_new = []
carrier_ch_list_new = []
data_sum = np.array(data_list).sum()
for i in range(len(carrier_ch_list)):
    if 100 * data_list[i] / data_sum >= 3:
        data_list_new.append(data_list[i])
        carrier_ch_list_new.append(carrier_ch_list[i])
    else:
        other_sum += data_list[i]
data_list_new.append(other_sum)
carrier_ch_list_new.append('其他航空')
# 绘制饼图
patches, l_text, p_text = plt.pie(np.array(data_list_new), labels=carrier_ch_list_new,
                                  autopct='%.2f%%', explode=[0.05 for i in carrier_ch_list_new])
for t in p_text:
    t.set_size(20)  # 设置百分比字体大小
plt.title('2013年各航司从纽约起飞的航班数占比图', fontsize=35)
plt.show()