一、Iris数据集介绍
A small classic dataset from Fisher, 1936. One of the earliest datasets used for evaluation of classification methodologies.
[更多数据集信息]
[文章算法来源:Visualizing KNN, SVM, and XGBoost on Iris Dataset、ML from Scratch with IRIS!!]
二、预览数据与处理
1、导入模块和数据集
# ----------导入模块和数据集----------
import pandas as pd
import numpy as np
from sklearn import datasets

iris = datasets.load_iris()

# 我们将仅使用花瓣的长度和宽度进行此分析
X = iris.data[:, [2, 3]]
y = iris.target

# 将鸢尾花数据放入pandas DataFrame中
iris_df = pd.DataFrame(iris.data[:, [2, 3]], columns=iris.feature_names[2:])

# 查看数据的前5行
print(iris_df.head())

# 打印数据集的唯一标签
print('\n' + 'The unique labels in this data are ' + str(np.unique(y)))

''' 输出:
   petal length (cm)  petal width (cm)
0                1.4               0.2
1                1.4               0.2
2                1.3               0.2
3                1.5               0.2
4                1.4               0.2

The unique labels in this data are [0 1 2]
'''
2、分割数据集
# ----------导入模块和数据集----------
from sklearn import datasets

iris = datasets.load_iris()

# 我们将仅使用花瓣的长度和宽度进行此分析
X = iris.data[:, [2, 3]]
y = iris.target

# ----------分割数据集----------
from sklearn.model_selection import train_test_split

# 将数据集分为训练和测试数据集
X_train, X_test, y_train, y_test = train_test_split(X, y, test_size=.3, random_state=0)

print('There are {} samples in the training set and {} samples in the test set'
      .format(X_train.shape[0], X_test.shape[0]))

''' 输出:
There are 147 samples in the training set and 3 samples in the test set
'''
3、数据预处理:标准化数据
# ----------导入模块和数据集----------
import pandas as pd
from sklearn import datasets

iris = datasets.load_iris()

# 我们将仅使用花瓣的长度和宽度进行此分析
X = iris.data[:, [2, 3]]
y = iris.target

# 将鸢尾花数据放入pandas DataFrame中
iris_df = pd.DataFrame(iris.data[:, [2, 3]], columns=iris.feature_names[2:])

# ----------分割数据集----------
from sklearn.model_selection import train_test_split

# 将数据集分为训练和测试数据集
X_train, X_test, y_train, y_test = train_test_split(X, y, test_size=.3, random_state=0)

# ----------数据预处理:标准化数据----------
from sklearn.preprocessing import StandardScaler

# X_scaled = (X - X.mean()) / X.std()
# 其中, X.mean()为数据集的均值, X.std()为数据集的标准差
sc = StandardScaler()

sc.fit(X_train)

X_train_std = sc.transform(X_train)
X_test_std = sc.transform(X_test)

print('After standardizing our features, the first 5 rows of our data now look like this:\n')
print(pd.DataFrame(X_train_std, columns=iris_df.columns).head())

''' 输出:
After standardizing our features, the first 5 rows of our data now look like this:

   petal length (cm)  petal width (cm)
0           1.438873          0.794200
1          -1.283757         -1.321269
2           1.268708          1.719718
3          -1.397200         -1.189052
4           0.531329          0.397550
'''4、查看数据分布
# ----------导入模块和数据集----------
import numpy as np
from sklearn import datasets
iris = datasets.load_iris()
# 我们将仅使用花瓣的长度和宽度进行此分析
X = iris.data[:, [2, 3]]
y = iris.target
# ----------分割数据集----------
from sklearn.model_selection import train_test_split
# 将数据集分为训练和测试数据集
X_train, X_test, y_train, y_test = train_test_split(X, y, test_size=.3, random_state=0)
# ----------查看数据分布----------
import matplotlib.pyplot as plt
from matplotlib.colors import ListedColormap
# 设置画布尺寸
plt.figure(figsize=(10, 6))
# s: 正方形 x: x型 o: 圆形
markers = ('s', 'x', 'o')
colors = ('red', 'blue', 'lightgreen')
classes = ('Setosa', 'Versicolour', 'Virginica')
cmap = ListedColormap(colors[:len(np.unique(y_test))])
for idx, cl in enumerate(np.unique(y)):
plt.scatter(x=X[y == cl, 0], y=X[y == cl, 1], color=cmap(idx),
marker=markers[idx], label=classes[cl])
# 创建图例
plt.legend()
plt.show()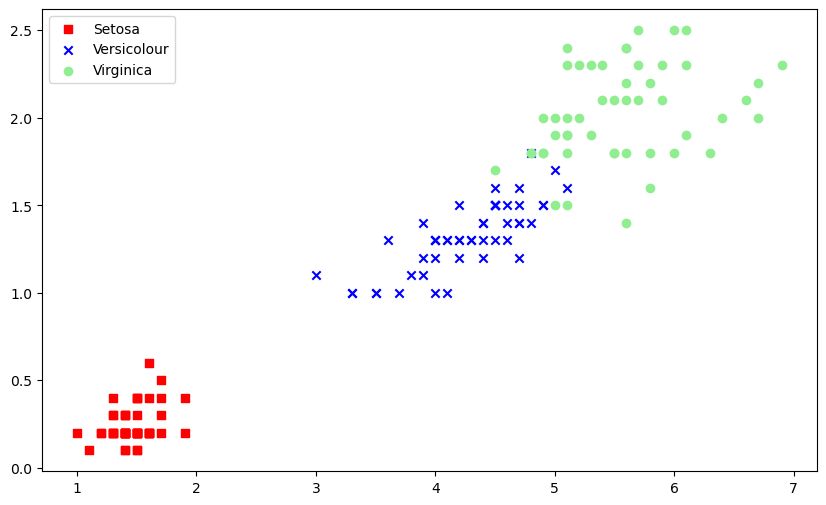 我们可以看到其中Setosa是线性可分离的,但另外两个不是。
5、标准化数据集
# ----------导入模块和数据集----------
import numpy as np
from sklearn import datasets

iris = datasets.load_iris()

# 我们将仅使用花瓣的长度和宽度进行此分析
X = iris.data[:, [2, 3]]
y = iris.target

# ----------分割数据集----------
from sklearn.model_selection import train_test_split

# 将数据集分为训练和测试数据集
X_train, X_test, y_train, y_test = train_test_split(X, y, test_size=.3, random_state=0)

# ----------数据预处理:标准化数据----------
from sklearn.preprocessing import StandardScaler

# X_scaled = (X - X.mean()) / X.std()
# 其中, X.mean()为数据集的均值, X.std()为数据集的标准差
sc = StandardScaler()

sc.fit(X_train)

X_train_std = sc.transform(X_train)
X_test_std = sc.transform(X_test)
三、图形化数据分布
1、导包
Seaborn:Seaborn is a Python data visualization library based on matplotlib. It provides a high-level interface for drawing attractive and informative statistical graphics.
import numpy as np
import pandas as pd
import seaborn as sns
import matplotlib.pyplot as plt
from sklearn import datasets
2、预览数据
iris_dataset = datasets.load_iris()
iris = pd.DataFrame(iris_dataset.data, columns=iris_dataset.feature_names)

print(iris.head(2))
''' 输出:
   sepal length (cm)  sepal width (cm)  petal length (cm)  petal width (cm)
0                5.1               3.5                1.4               0.2
1                4.9               3.0                1.4               0.2
'''
print(iris.info())
''' 输出:
<class 'pandas.core.frame.DataFrame'>
RangeIndex: 150 entries, 0 to 149
Data columns (total 4 columns):
 #   Column             Non-Null Count  Dtype
---  ------             --------------  -----
 0   sepal length (cm)  150 non-null    float64
 1   sepal width (cm)   150 non-null    float64
 2   petal length (cm)  150 non-null    float64
 3   petal width (cm)   150 non-null    float64
dtypes: float64(4)
memory usage: 4.8 KB
None
'''
3、处理数据
iris_dataset = datasets.load_iris()
iris = pd.DataFrame(iris_dataset.data, columns=iris_dataset.feature_names)
target_set = ['Iris-setosa', 'Iris-versicolor', 'Iris-virginica']
iris.loc[:, 'Species'] = [target_set[iris_dataset.target[i]] for i in range(len(iris_dataset.target))]
iris = iris.rename(columns={'sepal length (cm)': 'SepalLengthCm',
                            'sepal width (cm)': 'SepalWidthCm',
                            'petal length (cm)': 'PetalLengthCm',
                            'petal width (cm)': 'PetalWidthCm'}, errors="raise")
4、查看数据分布
萼片长度和萼片宽度关系图
fig = iris[iris.Species == 'Iris-setosa'].plot(kind='scatter', x='SepalLengthCm', y='SepalWidthCm', color='orange',
                                               label='Setosa')
iris[iris.Species == 'Iris-versicolor'].plot(kind='scatter', x='SepalLengthCm', y='SepalWidthCm', color='blue',
                                             label='versicolor', ax=fig)
iris[iris.Species == 'Iris-virginica'].plot(kind='scatter', x='SepalLengthCm', y='SepalWidthCm', color='green',
                                            label='virginica', ax=fig)
fig.set_xlabel("Sepal Length")
fig.set_ylabel("Sepal Width")
fig.set_title("Sepal Length VS Width")
fig = plt.gcf()
fig.set_size_inches(10, 6)
plt.show()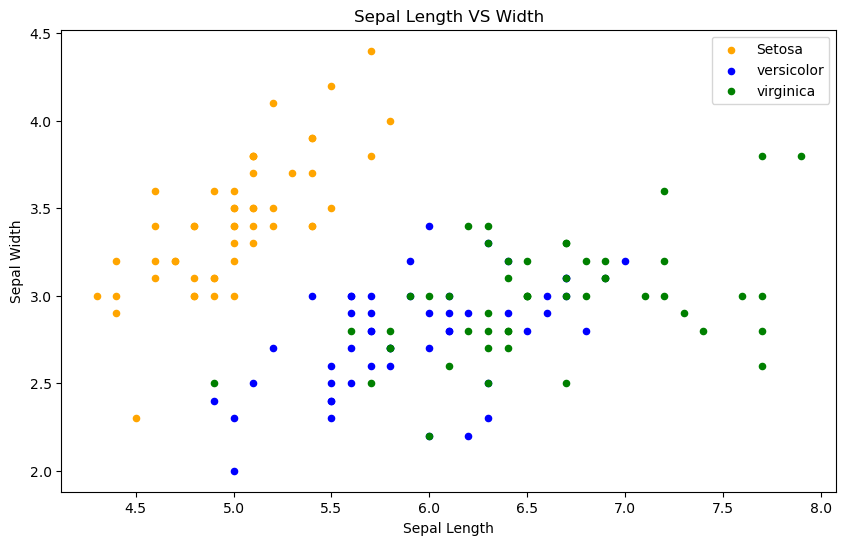
花瓣长度和花瓣宽度关系图
fig = iris[iris.Species=='Iris-setosa'].plot.scatter(x='PetalLengthCm',y='PetalWidthCm',color='orange', label='Setosa')
iris[iris.Species=='Iris-versicolor'].plot.scatter(x='PetalLengthCm',y='PetalWidthCm',color='blue', label='versicolor',ax=fig)
iris[iris.Species=='Iris-virginica'].plot.scatter(x='PetalLengthCm',y='PetalWidthCm',color='green', label='virginica', ax=fig)
fig.set_xlabel("Petal Length")
fig.set_ylabel("Petal Width")
fig.set_title(" Petal Length VS Width")
fig=plt.gcf()
fig.set_size_inches(10,6)
plt.show()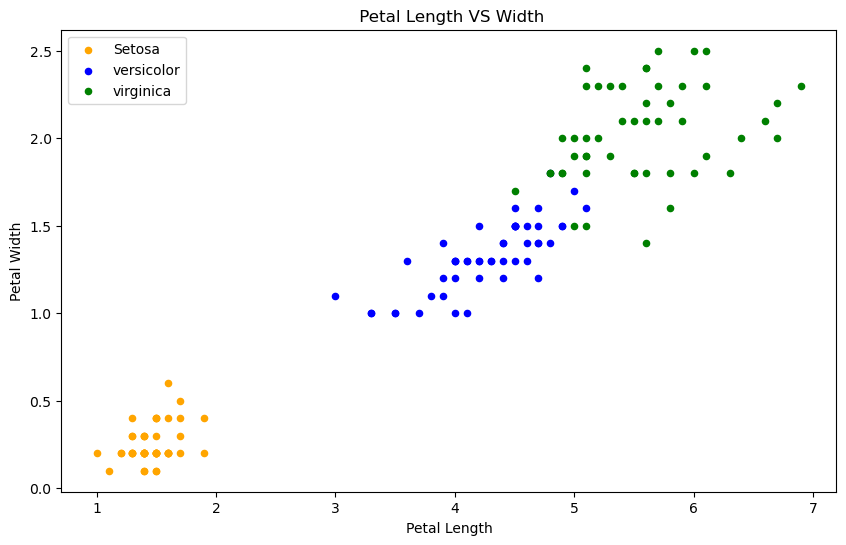
正如我们所看到的,与萼片特征相比,花瓣特征提供了更好的聚类划分。这表明花瓣可以帮助对萼片进行更好、准确的预测。我们稍后再检查。
花瓣和萼片数据分布情况
iris.hist(edgecolor='black', linewidth=1.2)
fig = plt.gcf()
fig.set_size_inches(12, 6)
plt.show()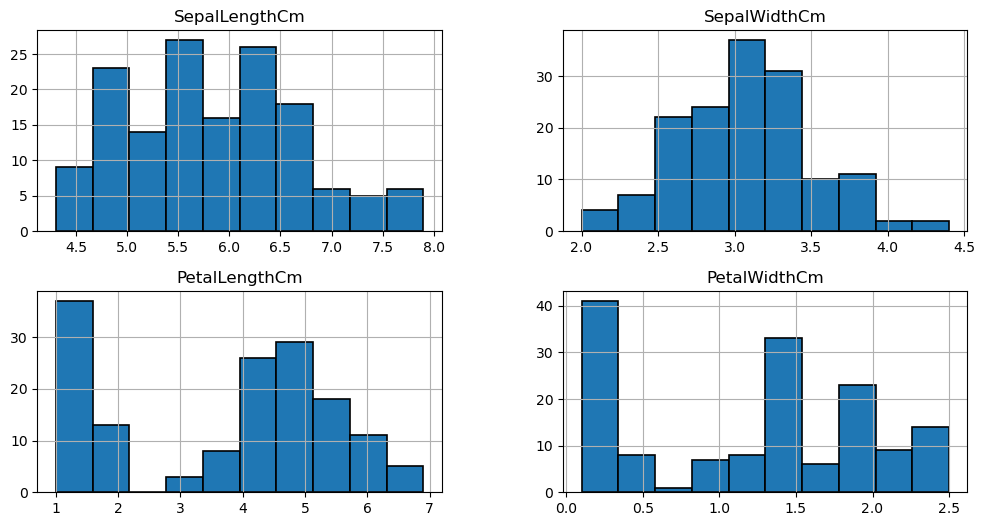
长度、宽度和物种之间关系图
plt.figure(figsize=(15, 10))
plt.subplot(2, 2, 1)
sns.violinplot(x='Species', y='PetalLengthCm', data=iris)
plt.subplot(2, 2, 2)
sns.violinplot(x='Species', y='PetalWidthCm', data=iris)
plt.subplot(2, 2, 3)
sns.violinplot(x='Species', y='SepalLengthCm', data=iris)
plt.subplot(2, 2, 4)
sns.violinplot(x='Species', y='SepalWidthCm', data=iris)
plt.show()
小提琴图显示了物种长度和宽度的密度。越薄的部分表示密度越低,而越胖的部分则表示密度越高。
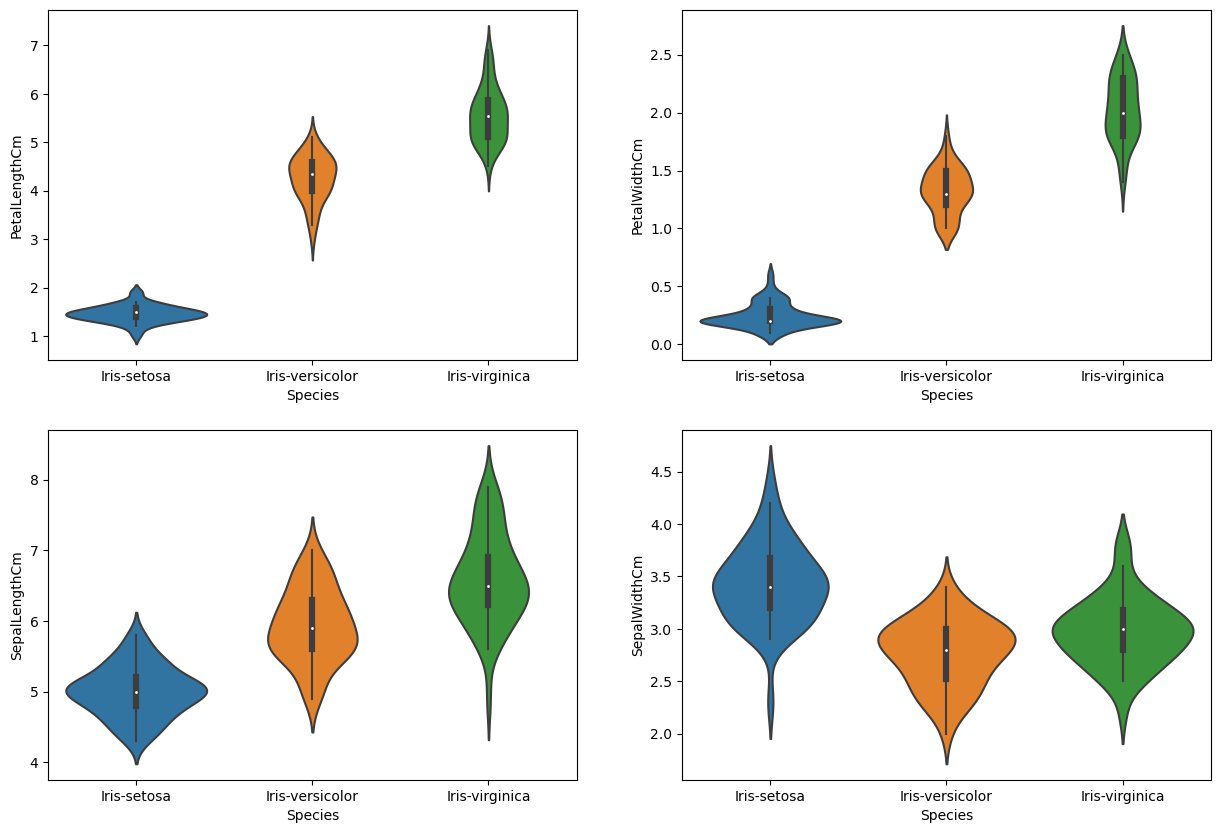
热力图
plt.figure(figsize=(7, 4))
sns.heatmap(iris.drop('Species', axis=1).corr(), annot=True, cmap='cubehelix_r')
plt.show()
萼片宽度和长度不相关花瓣宽度和长度高度相关。
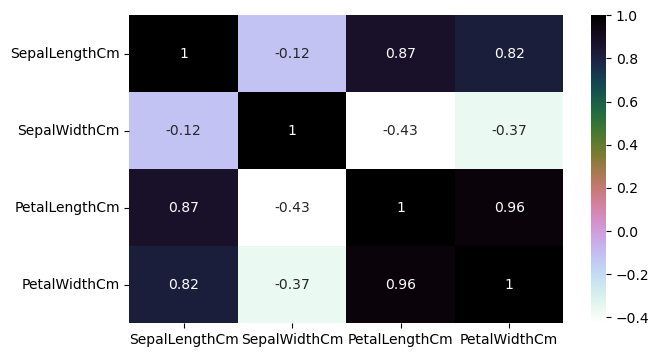
三、线性回归(Linear Regression)
训练
# ----------标准化数据集----------
# 参考标准化数据集

# ----------LR----------
from sklearn.linear_model import LinearRegression

lr = LinearRegression()
lr.fit(X_train_std, y_train)

print('The accuracy of the linear regression classifier is {:.2f} out of 1 on training data'
      .format(lr.score(X_train_std, y_train)))
print('The accuracy of the linear regression classifier is {:.2f} out of 1 on test data'
      .format(lr.score(X_test_std, y_test)))

''' 输出:
The accuracy of the linear regression classifier is 0.93 out of 1 on training data
The accuracy of the linear regression classifier is 0.91 out of 1 on test data
'''
可视化方法
# ----------SVC可视化方法----------
import numpy as np
import matplotlib.pyplot as plt
from matplotlib.colors import ListedColormap

def plot_decision_regions(X, y, classifier, test_idx=None, resolution=0.02):
    # 设置画布尺寸
    plt.figure(figsize=(10, 6))
    markers = ('s', 'x', 'o', '^', 'v')
    colors = ('red', 'blue', 'lightgreen', 'gray', 'cyan')
    classes = ('Setosa', 'Versicolour', 'Virginica')
    cmap = ListedColormap(colors[:len(np.unique(y))])

    # 绘制决策边界
    x1_min, x1_max = X[:, 0].min() - 1, X[:, 0].max() + 1
    x2_min, x2_max = X[:, 1].min() - 1, X[:, 1].max() + 1
    # meshgrid将x中每一个数据和y中每一个数据组合生成很多点,然后将这些点的x坐标放入到X中,y坐标放入Y中,并且相应位置是对应的
    xx1, xx2 = np.meshgrid(np.arange(x1_min, x1_max, resolution),
                           np.arange(x2_min, x2_max, resolution))
    Z = classifier.predict(np.array([xx1.ravel(), xx2.ravel()]).T)
    Z = Z.reshape(xx1.shape)
    # 画出不同分类的边界线
    plt.contourf(xx1, xx2, Z, alpha=0.4, cmap=cmap)
    plt.xlim(xx1.min(), xx1.max())
    plt.ylim(xx2.min(), xx2.max())

    for idx, cl in enumerate(np.unique(y)):
        plt.scatter(x=X[y == cl, 0], y=X[y == cl, 1],
                    alpha=0.8, c=cmap(idx), marker=markers[idx], label=cl)
    # 创建图例
    plt.legend()
    plt.show()
可视化
# ----------标准化数据集----------
# 参考标准化数据集

# ----------LR----------
from sklearn.linear_model import LinearRegression

lr = LinearRegression()
lr.fit(X_train_std, y_train)

# ----------可视化方法----------
def plot_decision_regions(X, y, classifier, test_idx=None, resolution=0.02):
    # 详见可视化方法
    pass

# ----------LR可视化----------
plot_decision_regions(X_test_std, y_test, lr)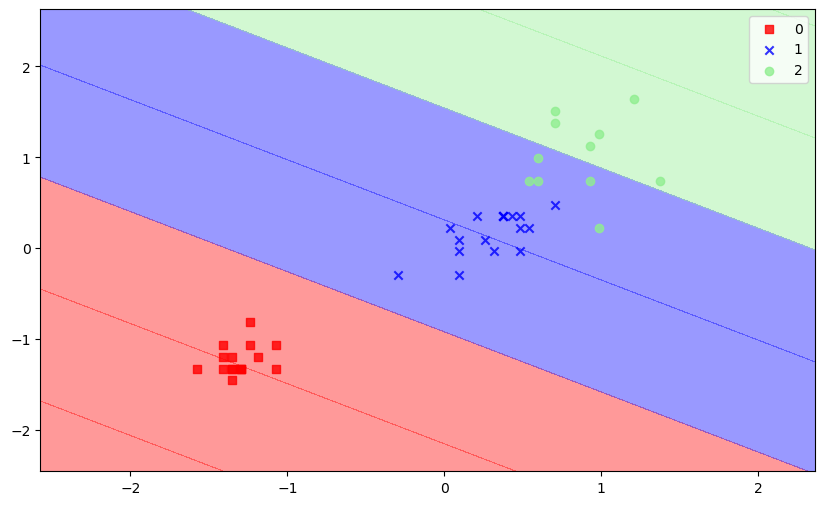
四、SVC(Support Vector Classification)
训练
# ----------标准化数据集----------
# 参考标准化数据集

# ----------SVC----------
from sklearn.svm import SVC

svm = SVC(kernel='rbf', random_state=0, gamma=.10, C=1.0)
svm.fit(X_train_std, y_train)

print('The accuracy of the svm classifier on training data is {:.2f} out of 1'
      .format(svm.score(X_train_std, y_train)))

print('The accuracy of the svm classifier on test data is {:.2f} out of 1'
      .format(svm.score(X_test_std, y_test)))

''' 输出:
The accuracy of the svm classifier on training data is 0.95 out of 1
The accuracy of the svm classifier on test data is 0.98 out of 1
'''
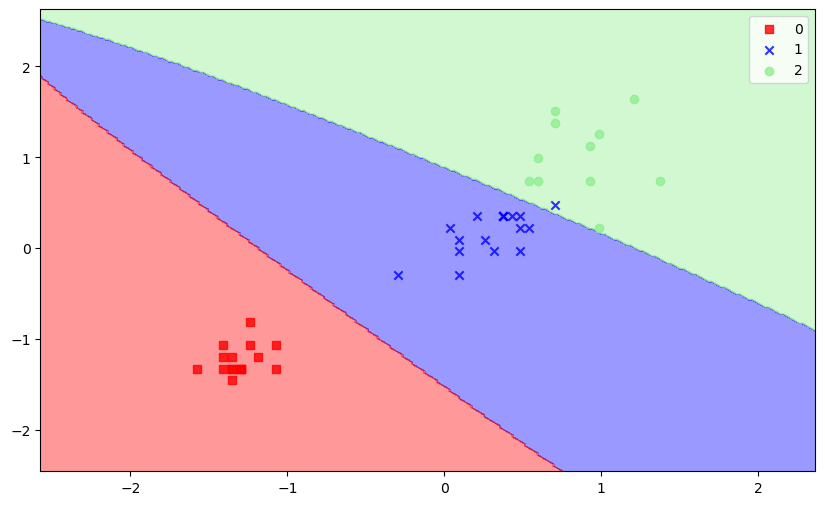
看起来我们的分类器表现得很好。让我们可视化模型如何对测试数据中的样本进行分类。
可视化
# ----------标准化数据集----------
# 参考标准化数据集

# ----------SVC----------
from sklearn.svm import SVC

svm = SVC(kernel='rbf', random_state=0, gamma=.10, C=1.0)
svm.fit(X_train_std, y_train)

# ----------可视化方法----------
def plot_decision_regions(X, y, classifier, test_idx=None, resolution=0.02):
    # 详见可视化方法
    pass

# ----------SVC可视化----------
plot_decision_regions(X_test_std, y_test, svm)
五、KNN(K-NearestNeighbor)
训练
# ----------标准化数据集----------
# 参考标准化数据集

# ----------KNN----------
from sklearn.neighbors import KNeighborsClassifier

knn = KNeighborsClassifier(n_neighbors=5, p=2, metric='minkowski')
knn.fit(X_train_std, y_train)

print('The accuracy of the knn classifier is {:.2f} out of 1 on training data'
      .format(knn.score(X_train_std, y_train)))
print('The accuracy of the knn classifier is {:.2f} out of 1 on test data'
      .format(knn.score(X_test_std, y_test)))

''' 输出:
The accuracy of the knn classifier is 0.95 out of 1 on training data
The accuracy of the knn classifier is 1.00 out of 1 on test data
'''
可视化
# ----------标准化数据集----------
# 参考标准化数据集

# ----------KNN----------
from sklearn.neighbors import KNeighborsClassifier

knn = KNeighborsClassifier(n_neighbors=5, p=2, metric='minkowski')
knn.fit(X_train_std, y_train)

# ----------可视化方法----------
def plot_decision_regions(X, y, classifier, test_idx=None, resolution=0.02):
    # 详见可视化方法
    pass

# ----------KNN可视化----------
plot_decision_regions(X_test_std, y_test, knn)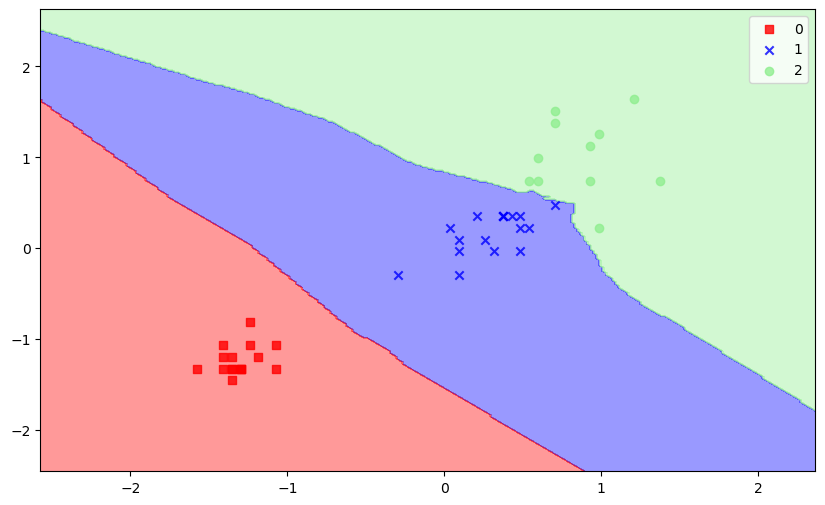
六、XGBoost
训练
# ----------标准化数据集----------
# 参考标准化数据集

# ----------XGBoost----------
import xgboost as xgb

xgb_clf = xgb.XGBClassifier()
xgb_clf = xgb_clf.fit(X_train_std, y_train)

print('The accuracy of the xgb classifier is {:.2f} out of 1 on training data'.format(xgb_clf.score(X_train_std, y_train)))
print('The accuracy of the xgb classifier is {:.2f} out of 1 on test data'.format(xgb_clf.score(X_test_std, y_test)))

''' 输出;
The accuracy of the xgb classifier is 0.99 out of 1 on training data
The accuracy of the xgb classifier is 0.98 out of 1 on test data
'''
可视化
# ----------标准化数据集----------
# 参考标准化数据集
# ----------XGBoost----------
import xgboost as xgb
xgb_clf = xgb.XGBClassifier()
xgb_clf = xgb_clf.fit(X_train_std, y_train)
# ----------可视化方法----------
def plot_decision_regions(X, y, classifier, test_idx=None, resolution=0.02):
# 详见可视化方法
pass
# ----------XGBoost可视化----------
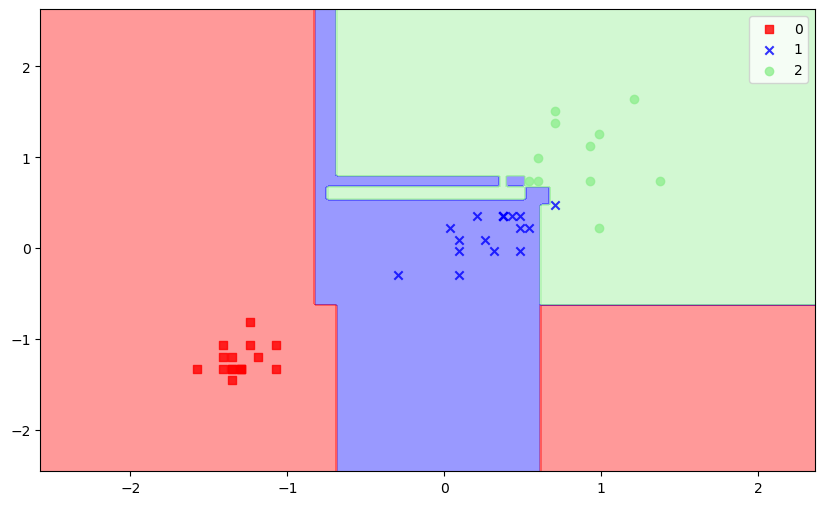
plot_decision_regions(X_test_std, y_test, xgb_clf)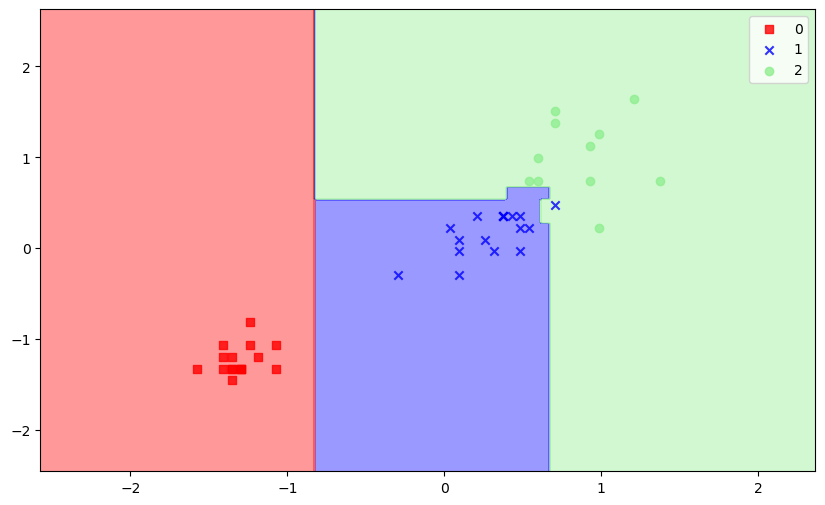 七、随机森林(Random Forest)
训练
# ----------标准化数据集----------
# 参考标准化数据集

# ----------Random Forest----------
from sklearn.ensemble import RandomForestClassifier

rfc = RandomForestClassifier(n_estimators=25,oob_score=True)
rfc.fit(X_train_std, y_train)

print('The accuracy of the linear regression classifier is {:.2f} out of 1 on training data'
      .format(rfc.score(X_train_std, y_train)))
print('The accuracy of the linear regression classifier is {:.2f} out of 1 on test data'
      .format(rfc.score(X_test_std, y_test)))

''' 输出;
The accuracy of the random forest classifier is 0.99 out of 1 on training data
The accuracy of the random forest classifier is 0.96 out of 1 on test data
'''
可视化
# ----------标准化数据集----------
# 参考标准化数据集

# ----------Random Forest----------
from sklearn.ensemble import RandomForestClassifier

rfc = RandomForestClassifier(n_estimators=25,oob_score=True)
rfc.fit(X_train_std, y_train)

# ----------可视化方法----------
def plot_decision_regions(X, y, classifier, test_idx=None, resolution=0.02):
    # 详见可视化方法
    pass

# ----------Random Forest可视化----------
plot_decision_regions(X_test_std, y_test, rfc)